Timeline Chart
Create a timeline chart to visualize your data
As seen on:


A timeline chart is an infographic that illustrates the milestones of events
It’s an effective way to visualize and organize information over time, so for example it could be a useful aid for project management or a clear visual way of displaying historical events. A timeline chart can help us better understand the order of different events and when they occur. That in turn can help us see the bigger picture within a specific time period, and even sometimes discern a pattern of cause and effect.
The best way to display the different events is to order them from earliest to latest, with a timescale to show the chronological sequence. Timeline charts can be presented horizontally or vertically, but the most popular approach is the horizontal one.
How to create a timeline chart in 4 steps
1. Decide on the topic

Clearly the first step is to decide what topic you want to illustrate with your timeline chart and research your subject. Don’t forget to add a clear title to your chart.
2. Determine the number

Next, think about how many milestones you want to present in your timescale. Typically there are 4 to 7 events in a timeline chart. It can be more or less of course but you need to bear in mind that a timeline should only include the most important events if your want viewers to understand them at first sight.
3. Create a framework

Firstly consider positive circumstances which could influence your company. It’s essential that a company is always on the look out for external opportunities and takes advantage of them. The ability to correctly spot new trends early can bring huge success.
4. Add a period of time, text, and images

Next, add the time period for your events, for example dates, months or days etc. And finally add the name of the milestone next to each period of time. If you want to make your timeline chart even more informative, you can also include photos or short descriptions next to each event.
Example of a timeline chart
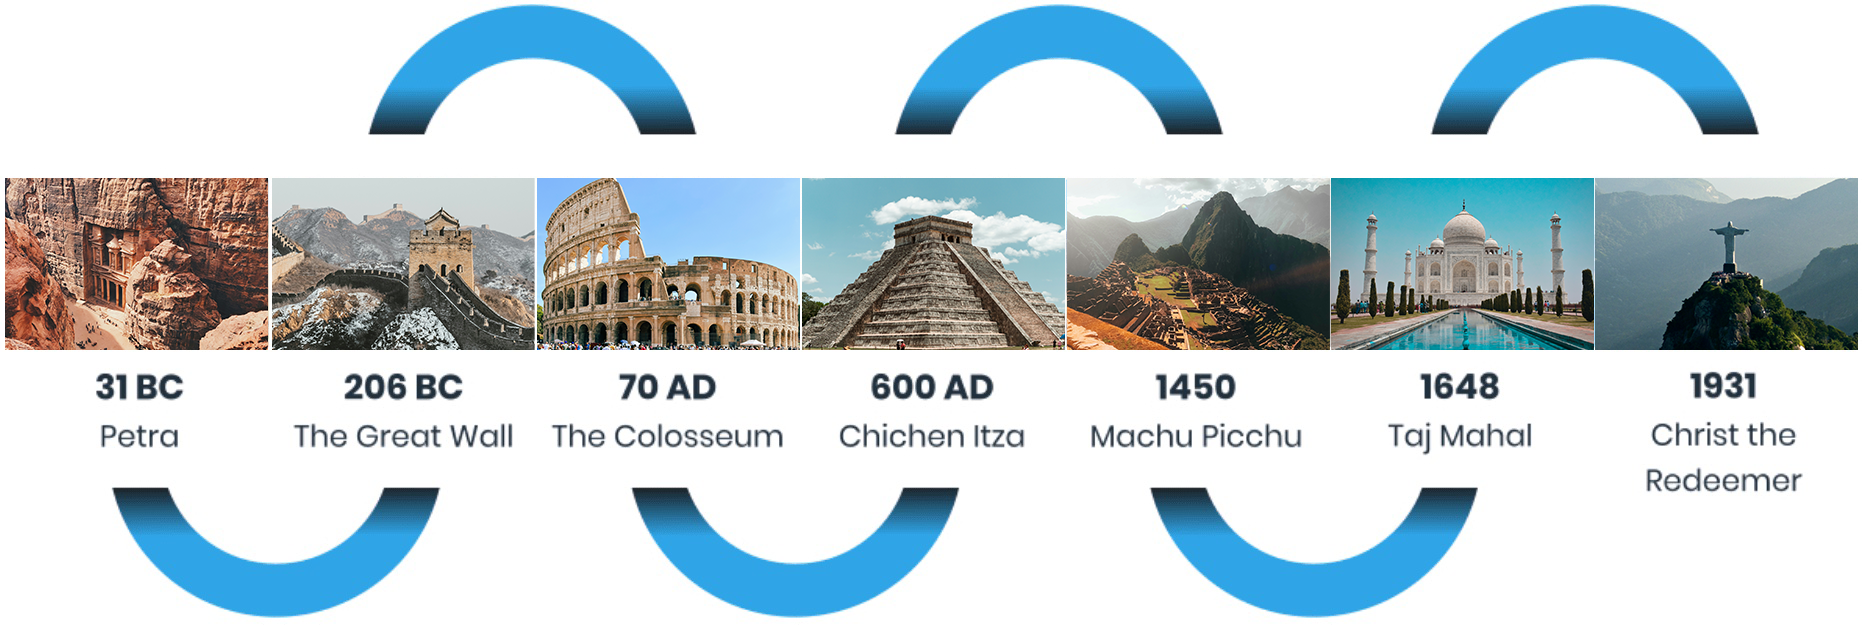
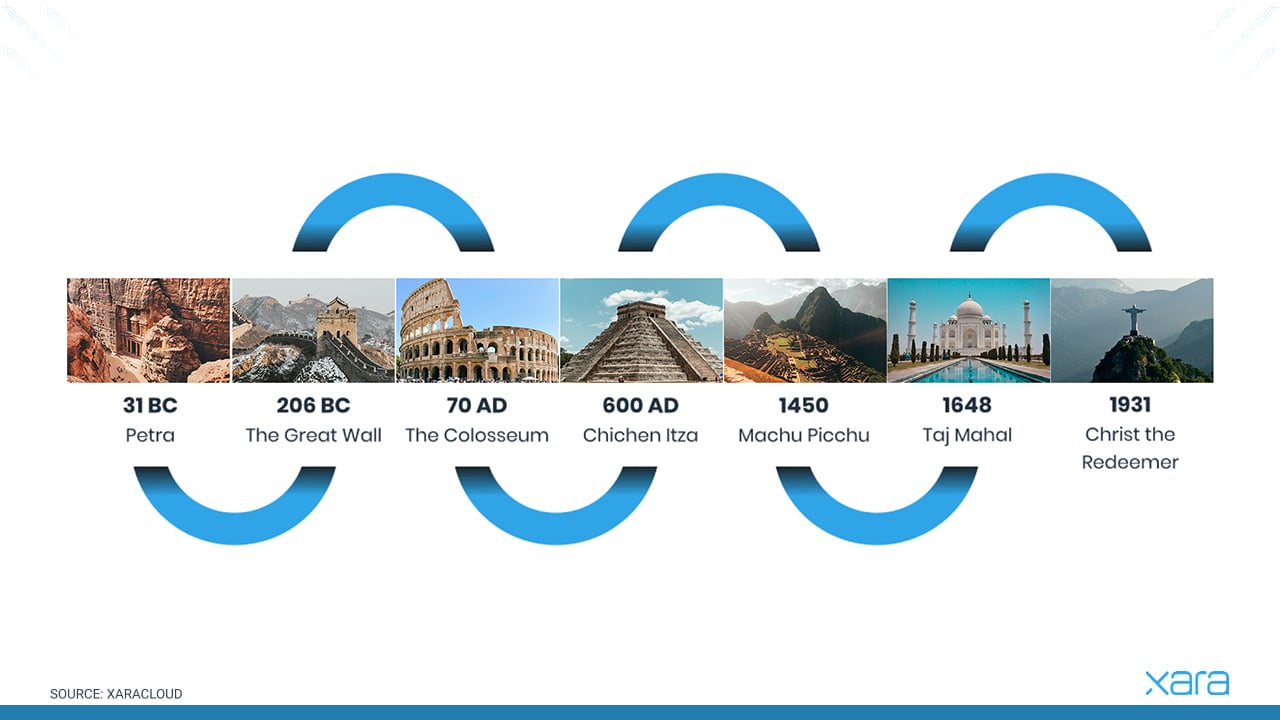
Our chosen topic is the new seven wonders of the world. The chronological sequence, from earliest to latest, is Petra, the Great Wall of China, the Colosseum, Chichen Itza, Machu Picchu, Taj Mahal and Christ the Redeemer. So first we add these seven milestones to our timeline chart, then we insert the date of construction next to each wonder and give it a title. And finally, to make it more visual and beautiful, we insert photos of each site.
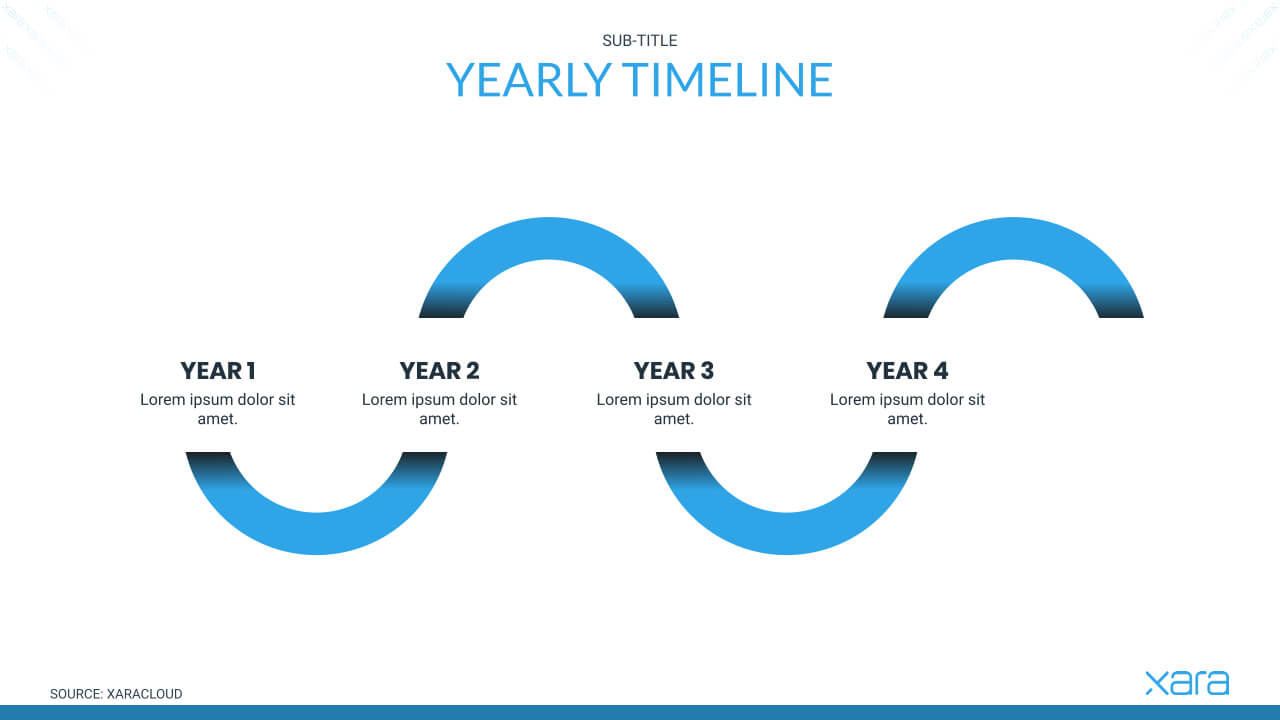
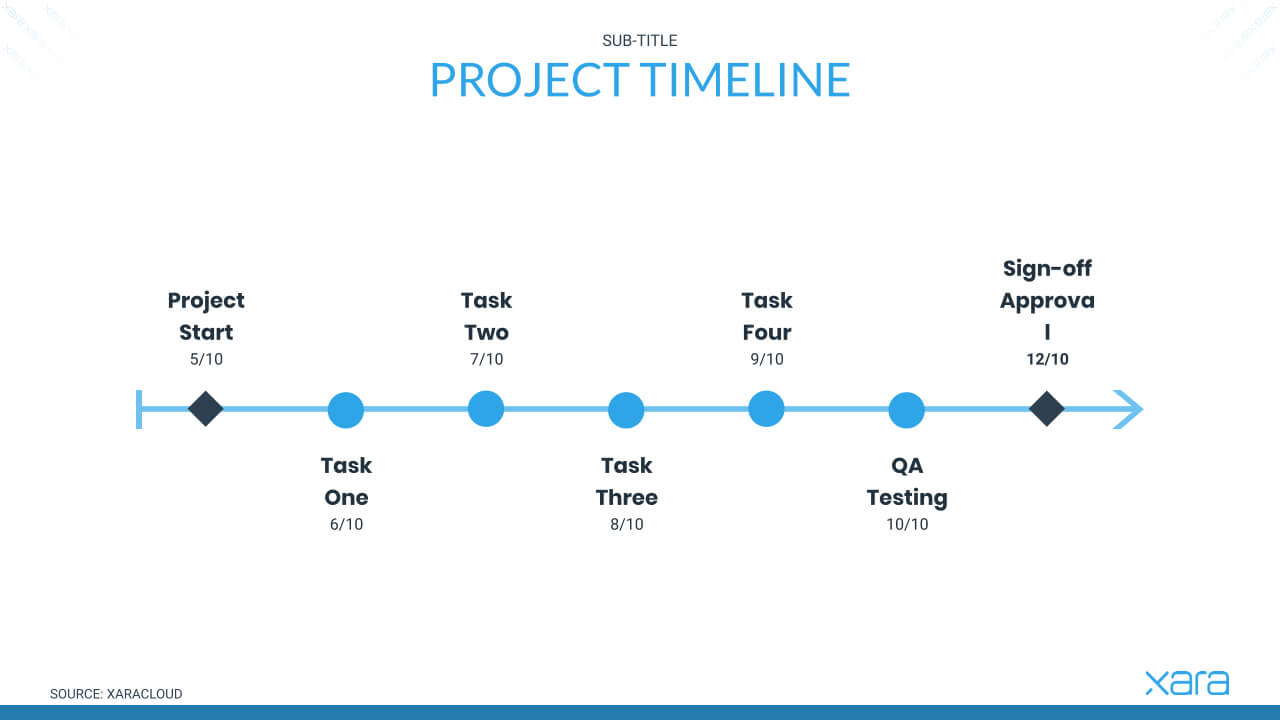
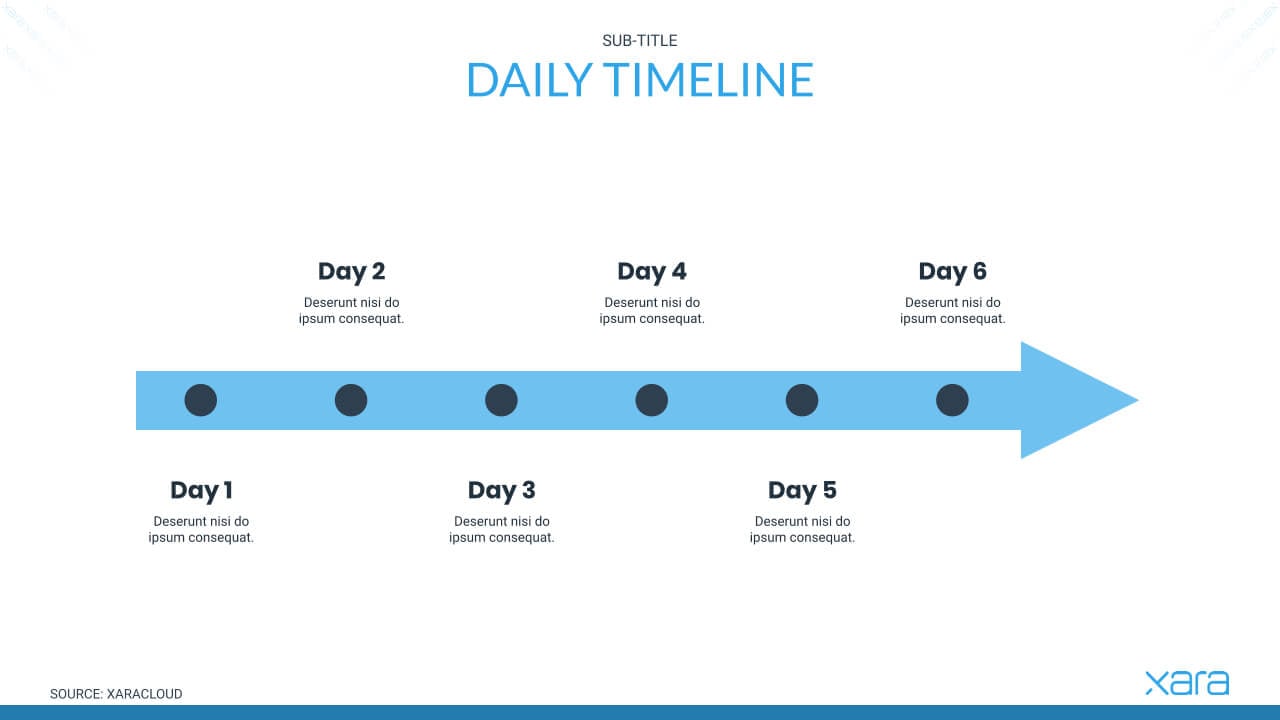
Timeline template
You can customize every detail about your timeline, from fonts to text colors, text size, lines, background etc.
Make your beautiful timeline in Xara Cloud
The timeline chart can be a very beneficial infographic for organizing and visualizing different events in chronological order. Obviously content is key if you want to create a valuable timeline that reveals the most relevant milestones of a specific topic. However, the design of your timeline chart needs to be considered as well. A great design will highlight the events on your timeline and show their order in an easy to understand and interesting way.
To help you achieve this, Xara offers a wide selection of eye-catching templates for timeline charts, and indeed for business documents in general. Xara is an easy-to-use service, which allows you to collaborate with your teammates and together decide on colors, shapes, fonts and charts for your documents. What’s more you can even apply the colors of a chosen image or your brand to all your business documents.
If you want to stand out from the crowd with professional-looking design documents, start your Xara free trial now!