Online Table Maker
Create a clean and elegant table in minutes
✔ Save time designing your table charts and let your data do the talking.
✔ Create a table chart straight from your browser.
✔ Collaborate remotely with your team, enable file permissions, edit access, and more.
✔ Intuitive interface with multiple editing tools.
✔ Choose from a variety of free table templates with easy customization.
✔ Create a standardized table to maintain brand consistency. Fast and easy.
✔ Easily copy and paste from Excel or Google Sheets.
✔ Import your CSV file or PDF file into ready-made templates.
As seen on:


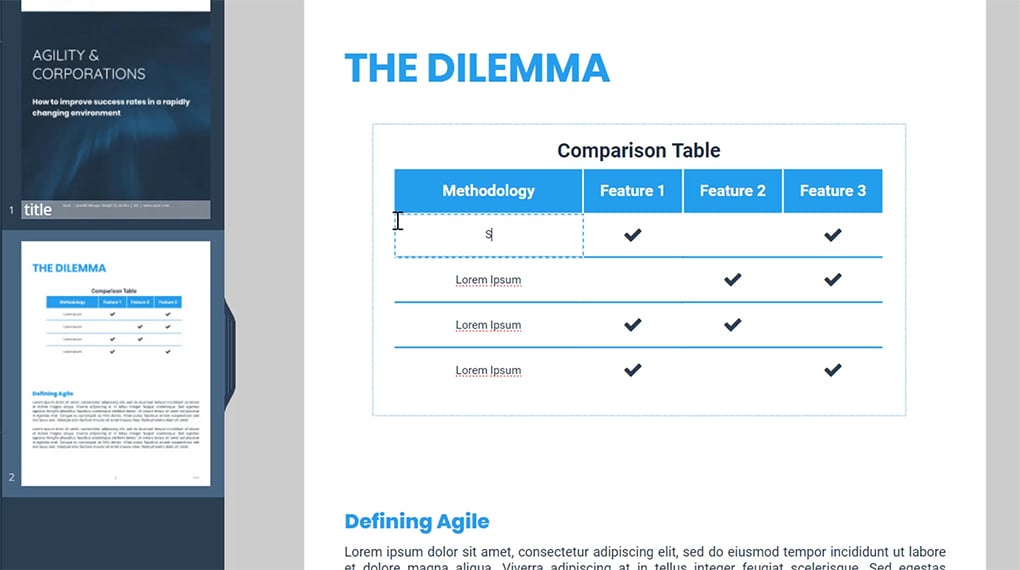
Table Charts Organize Information And Data Values
With a table maker, you can sort categories and values in rows or columns to simplify comparing values. Use our table chart to bring life to your data. Import files, add rows, remove rows, and style your tables online.
Just drag and drop to start designing. Type in the cells to add your values and create a table chart to prepare visual representations of your raw data. Add and edit elements such as diagrams, bar graphs, pie charts, and more.
When To Use Tables Vs. Other Diagrams?
- A table is preferable when there is too much data for a diagram to be clear. Use tables to display complex quantitative or qualitative data.
- When you need to present specific values in your report or presentation. Tables are better than bar charts because they focus on the values rather than their visual representation.
- A bar graph, pie chart, or any other table chart is more appropriate when you want to display data in a quick and engaging way. For example, when you pitch your business idea to investors, you don’t have much time to spare, so a table chart maker can come in handy.
- Bar charts are the best diagrams to use when comparing data or illustrating trends. For example, a bar chart or a plot will reflect an increase in sales more effectively than columns and rows.
- Scatter plots are ideal when you want to illustrate the relationship between different data sets. If, for instance, you want to see whether introducing a brand guideline increases the production of brand-consistent content, you should use a scatter plot.
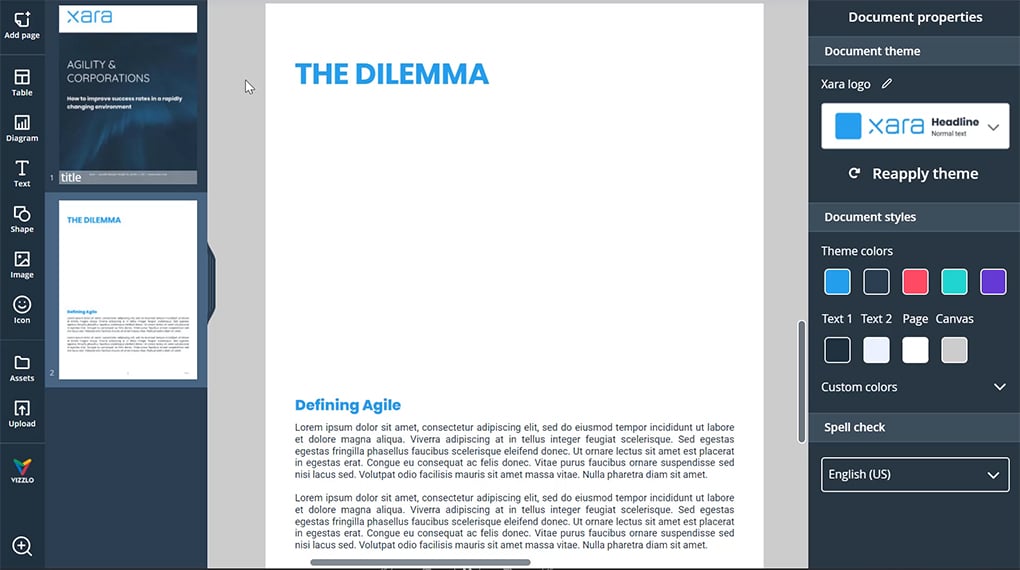
With Xara’s Table Templates, Creating Tables Is as Easy as 1-2-3
Our table chart maker offers a variety of free table templates. Start by picking your favorite template, then style it as your own. You can edit the size, shape, colors, fonts, table frame, table title, and so much more.
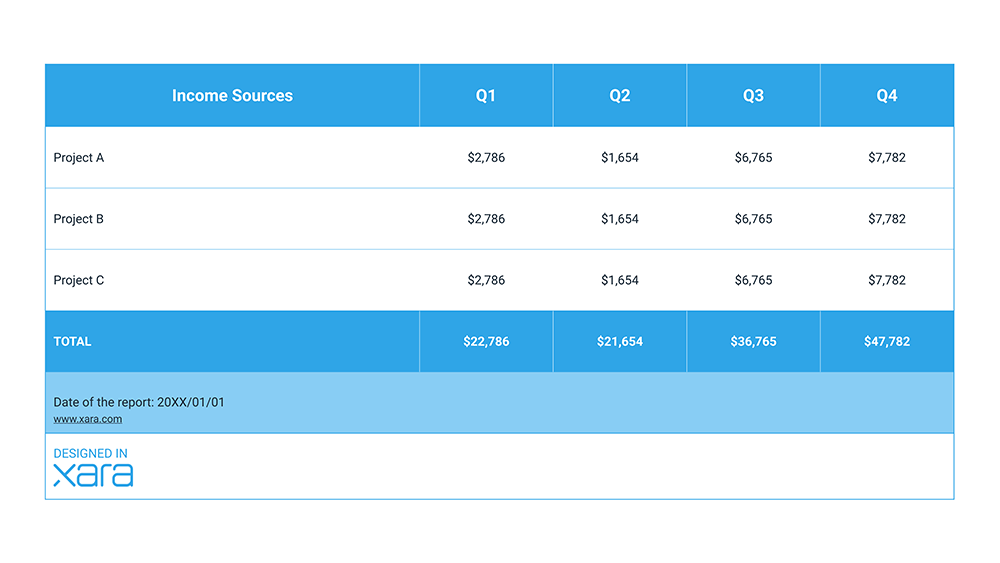
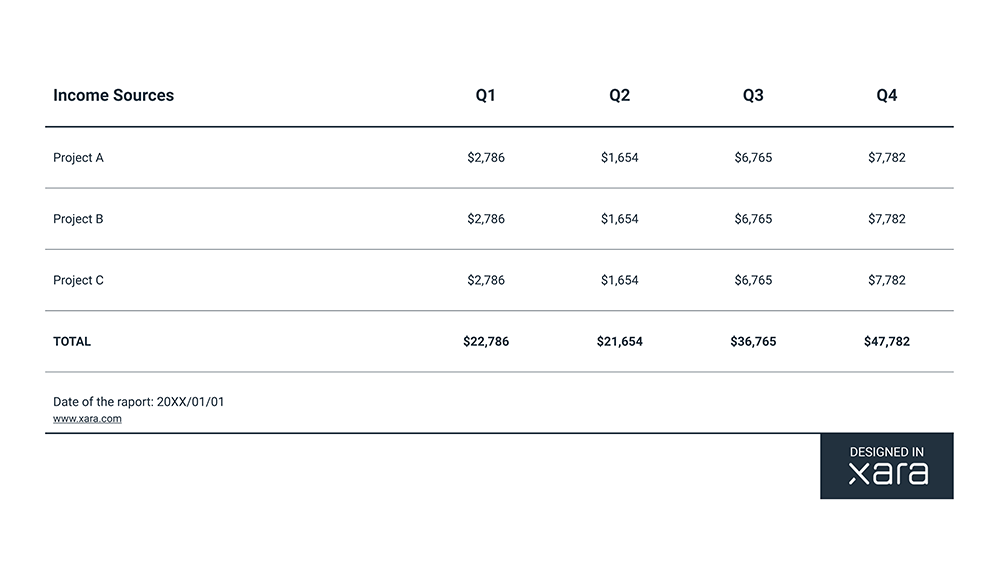
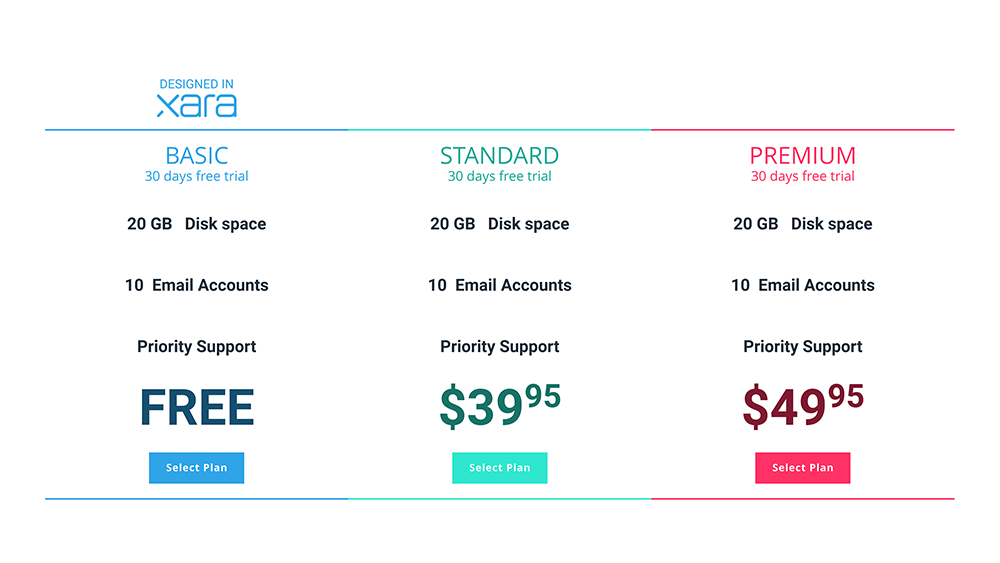
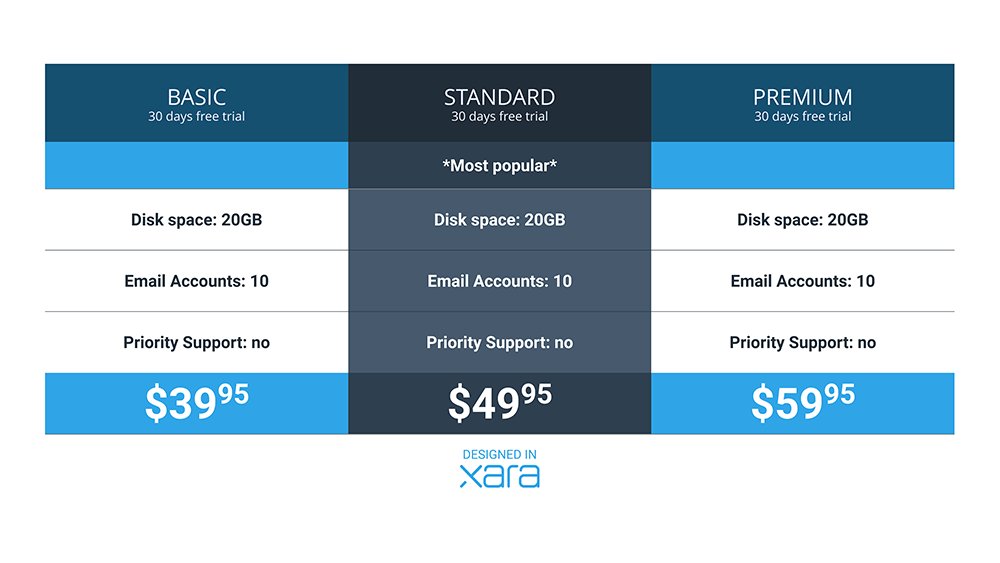
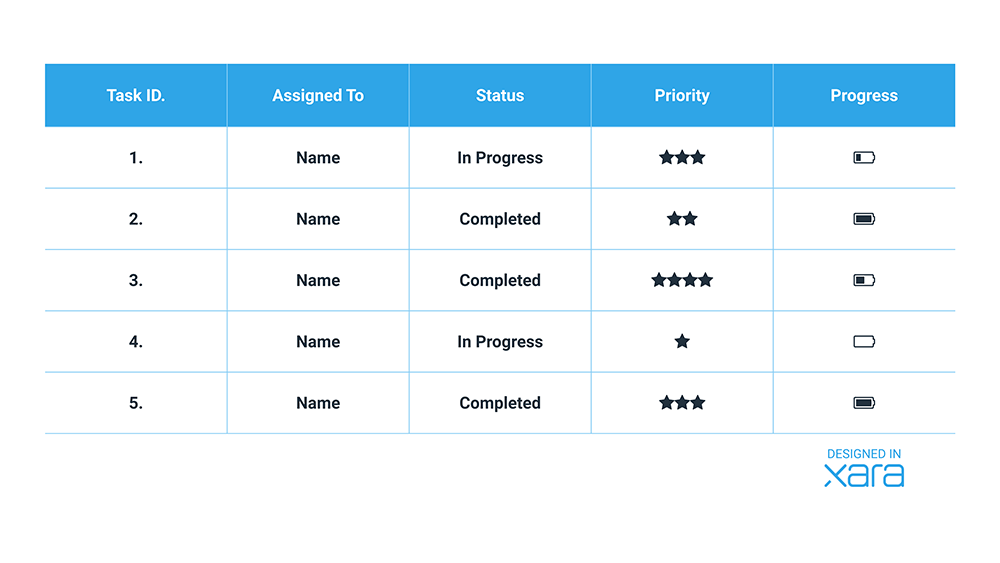
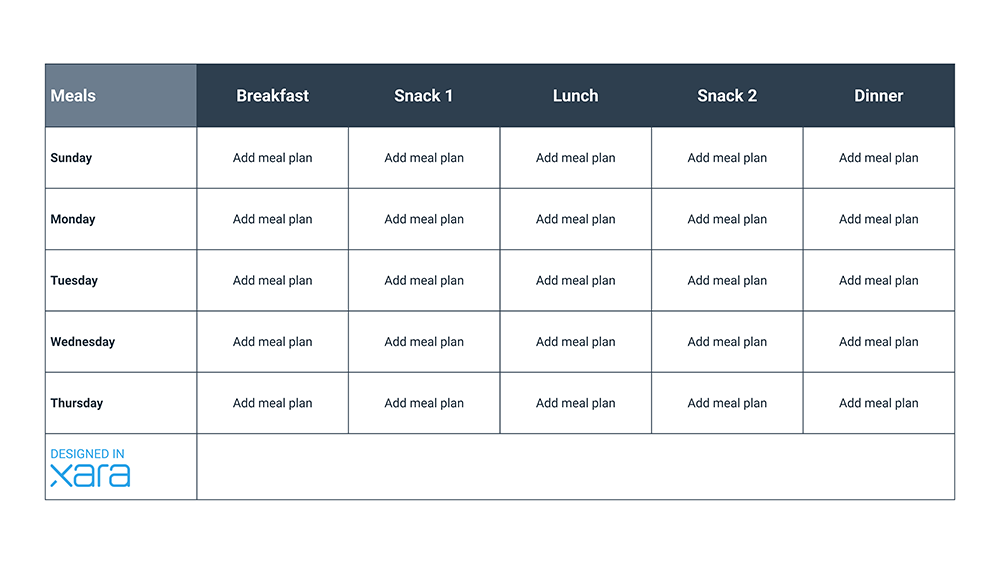
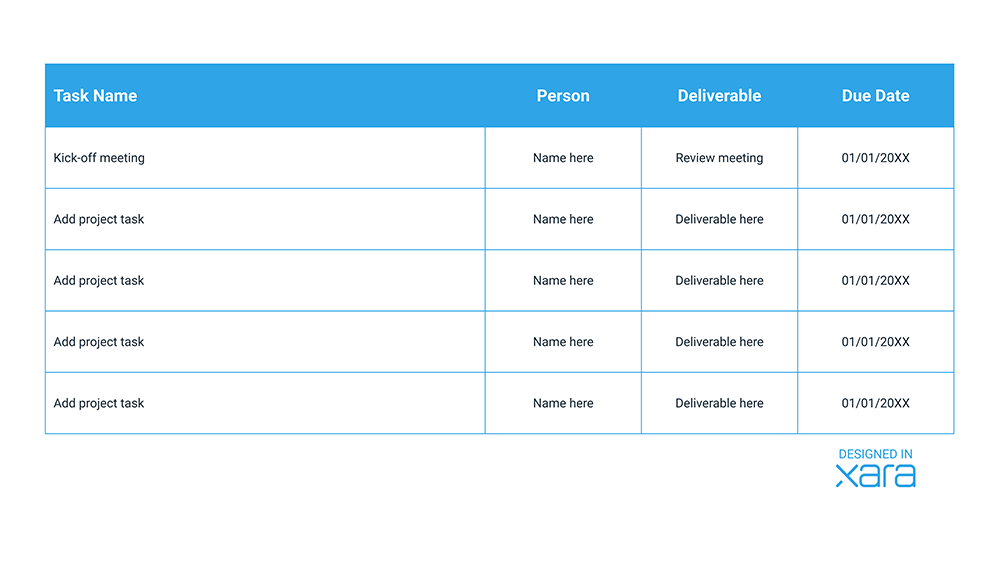
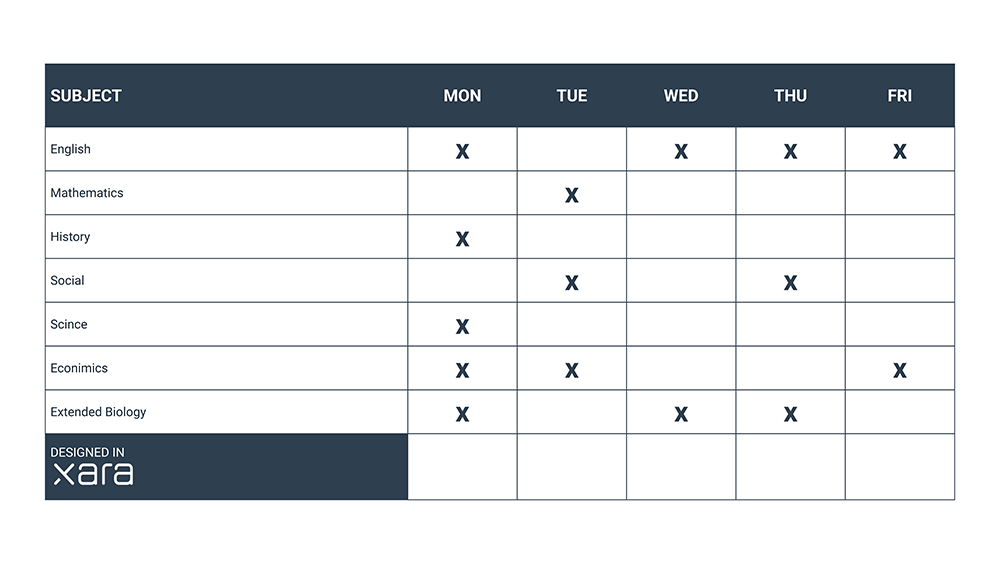
Table Templates
With so many ready-to-go templates, you never have to start from scratch. Your only concern is data entry. Start from a PDF file, or input data manually. You can customize every detail about your table, starting with adding colors and fonts to match your brand, to rows, columns, and images.
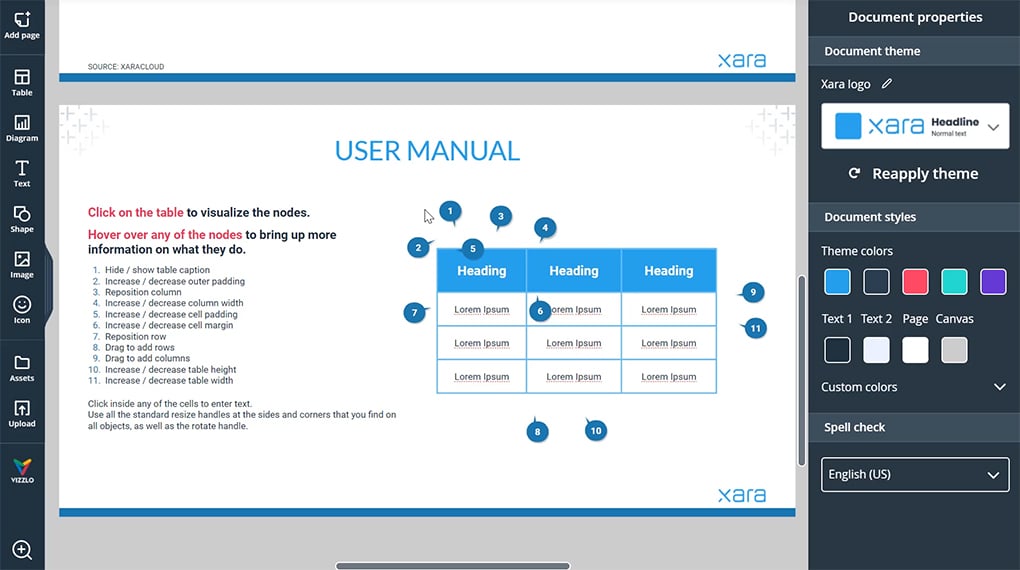
How to How to Create a Table With Xara Cloud
1. Go to the table section and select a table template
2. Fill in your information and data
3. Click here to start with table maker introduction
How Do I Make a Printable Table?
Printing tables is a piece of cake with our online table chart maker. Click the “print” button, and a PDF version of the document will be downloaded.
P.S: Before you click “print” make sure that you get the size of the document right. In the online table maker, click “resize” and choose the right size for you. Export your work and create a hard copy of your tables.
Create a Table Chart That Reads Well: 6 Expert Tips

1. Start with your reader in mind. Use the table chart maker to adapt the table to their knowledge and expertise and make an eye-catching design.

2. Don’t overcrowd the table. An overload of information will make it difficult to read. Aim for simple features, similar to Excel or other popular tables that users have seen before.

3. Always include sources in your table chart. Proof of credibility is key when presenting data to users.

4. When you design a table, think about guiding the reader visually. Use colors, fonts, and lines to make the table intuitive to read and interpret. Use the left panel tool section to style your tables.

5. Center the text and align the numbers to the right. This way, your table charts will always be easy to scan and compare.

6. Order the information in a way that makes sense. Use numbering to guide users through a step-by-step approach.
What Is a Table Chart?
A table chart is a way of organizing data in rows and columns by different categories and values. Use table charts when you want to compare or track changes in data over time. They’re also excellent for preparing raw data before using other visualization tools like diagrams.
You can use them to display both quantitative and qualitative data. You can also customize charts to highlight different aspects of the spreadsheet data set. With our online table chart maker, you must drag and drop a table template, click to customize it to your liking and type in the data.
You can embed the table chart into your website, other business or brand documents (like proposals or product sheets), or export and print it.
Create Visually Stunning Table Charts With Xara's Online Table Maker
Defined by simplicity and flexibility, Xara’s data table maker makes it fun and fast to design your own table within minutes. Whether you’re elbow-deep in a graphic design document or just looking for a quick way to make table charts for an internal corporate presentation, Xara has everything you need to get the job done.

Add impacting visuals to your marketing and business content.
Frequently Asked Questions
What is Xara’s Table Maker, and how can it enhance my data presentation?
Xara’s Table Maker allows you to create visually appealing tables to showcase your data. It offers an easy way to structure complex information for reports, presentations, and other data-heavy documents.
Does the Xara Table Maker offer customizable templates?
Yes, Xara provides professionally designed, fully customizable table templates. These will help fast-track your data visualization process and ensure your brand aesthetics are on point.
Can I use Xara’s Table Maker to create charts or graphs?
Yes. While Xara’s Table Maker is primarily designed for creating tables, it can also be used to create a variety of charts and graphs.
Is Xara suitable for non-designers?
Absolutely! Xara’s Table Maker is designed with simplicity in mind, making it accessible for both designers and non-designers. It uses easy drag-and-drop tools, so you don’t need any advanced design skills to design tables.
Can I share or publish tables created with Xara’s Table Maker?
Yes, you can publish, share, or download your tables in high-resolution formats.
Can I collaborate with my team on table creation using Xara’s Table Maker?
Yes, Xara’s online table chart maker supports real-time collaboration. You can invite your team to edit, post comments, leave feedback, and so much more.