T-chart
Create T-chart to help you make decisions in any situation where there are two sides to a subject
As seen on:


What is a T-chart?
A T-chart is a great tool for helping you make decisions in any situation where there are two sides to a subject. And the subject can be anything: a project, an idea, a problem, etc.
Listing both sides of the situation side by side should give you a clear overview, help you to compare and contrast easily and give proper perspective to the whole subject. The result should be better decisions.
Expert tips to create a T-chart
Label your chart

Remember to add useful titles, not just for the chart, but also for the columns.
Add some context

Adding some context will help anyone collaborating with you to better understand the purpose.
Keep it simple

Keep your fonts and colors simple to focus attention on the content (this is easy with Xara Cloud, you simply have to select a color palette and text style scheme).
Collaboration

Try to collaborate with more people to get different points of view. Sometimes a colleague can see new perspectives that would not occur to you.
How to use a T-chart?
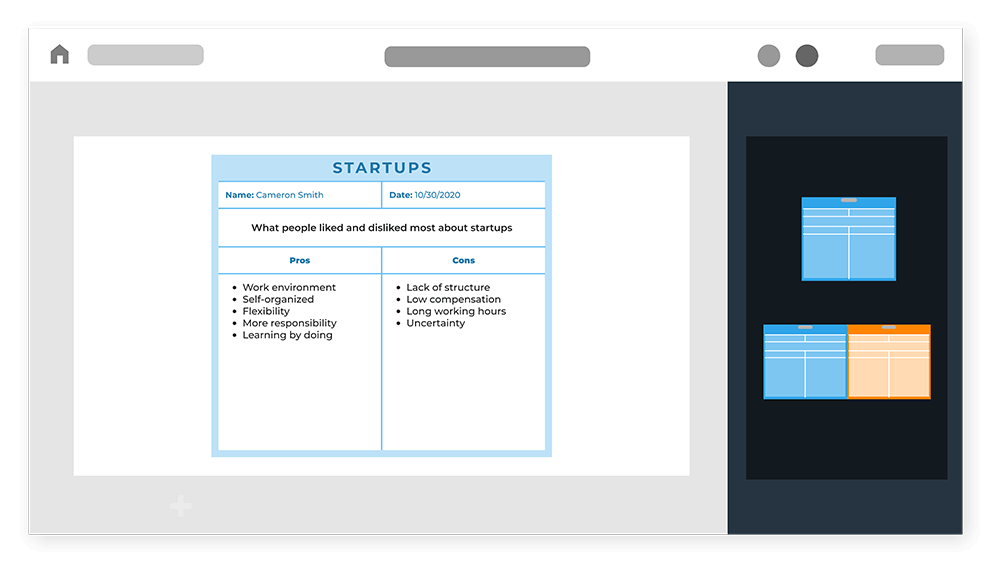
Pros and cons — For example if you are trying to decide whether to start a new partnership with a company, honestly listing all the pros and cons side by side will force you to consider both sides of the coin and make a properly balanced decision.
Advantages and disadvantages — Just like pros & cons, it will help you analyze a decision in depth, with all the information to make the right choice.
Problems and solutions — Listing all the possible problems and solutions side by side can be a great aid to creative problem solving.
Facts vs opinions — It can be illuminating to separate the information we know for sure from information based on assumptions.
Strengths and weaknesses — Similar to a SWOT analysis, but even quicker!
Cause and effect — Understanding what is happening (the effect) and why it happens (the cause) will help you to improve your analytical skills and do better in school and life in general.
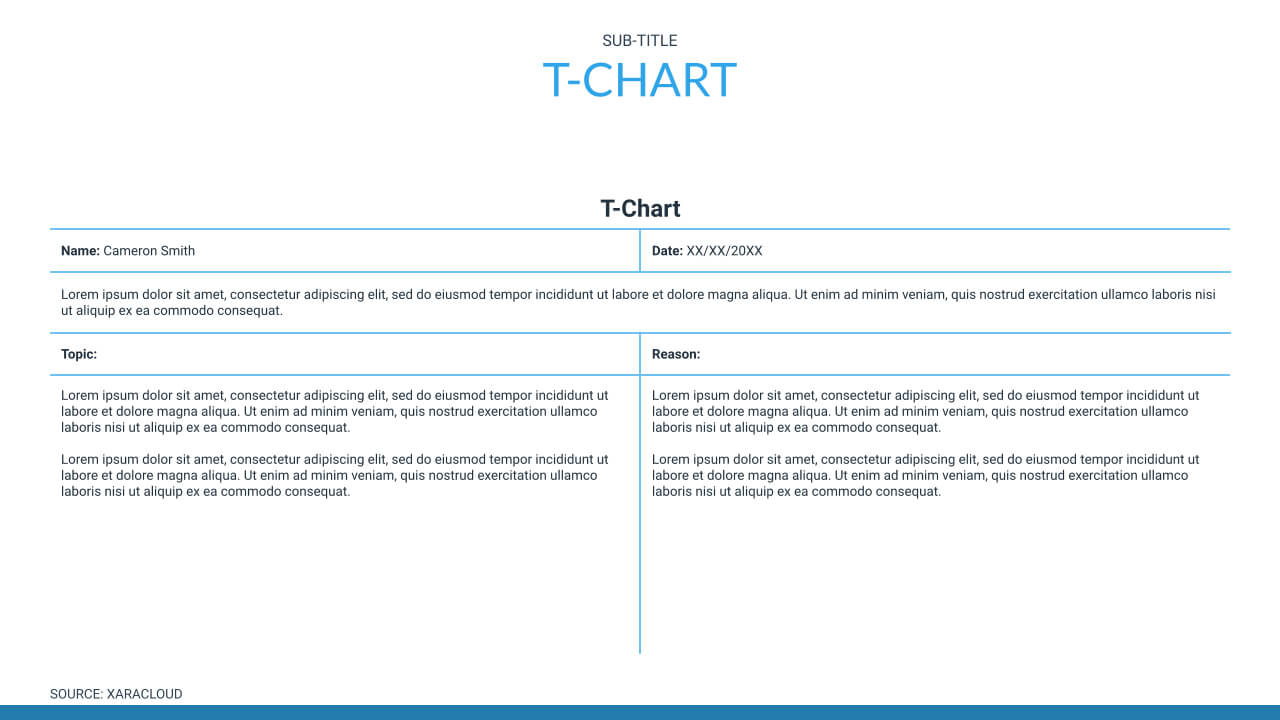
T-chart template
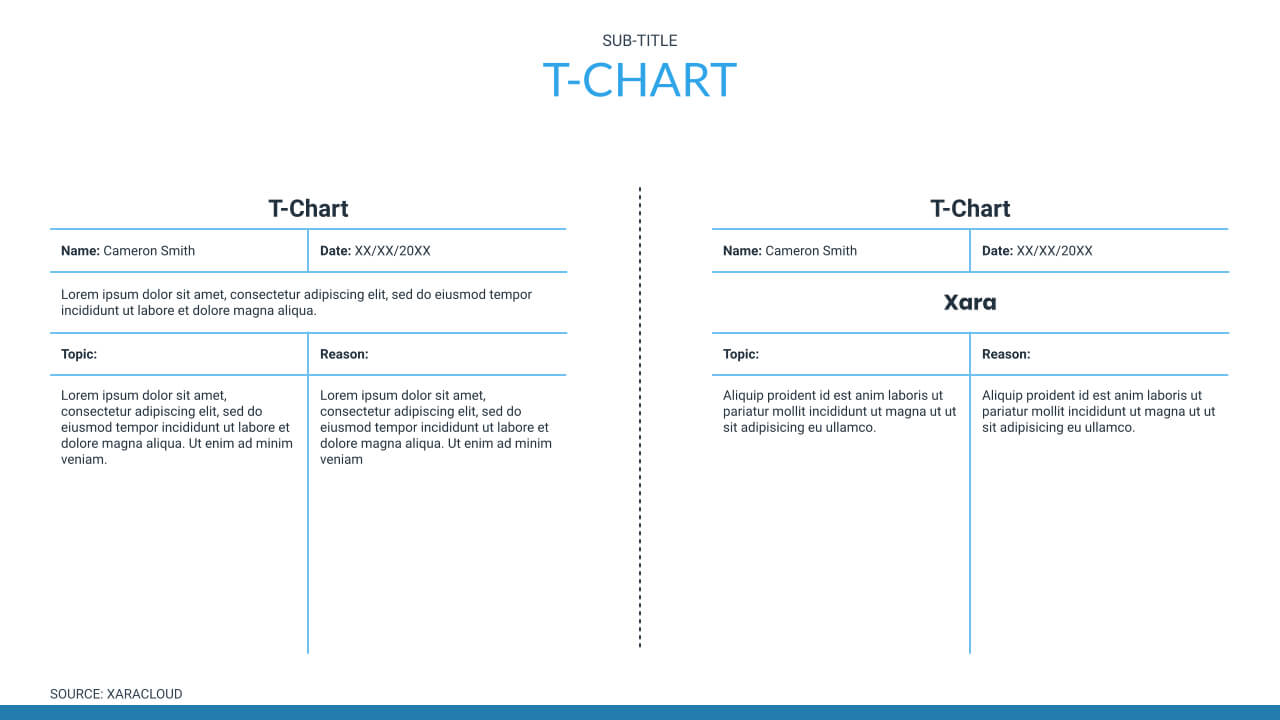
You can customize every detail about your T-chart, from fonts to text colors, text size, lines, background etc.
Create T-chart in Xara Cloud
You can open your T-chart directly from this page, or use our library in Xara Cloud to find the chart you want. Your chart will be automatically branded to the selected color palette of your document. This could be the brand colors of your company if you’re creating a chart for business purposes, or it could be any colors that you like.
To edit your chart, simply click on it and type or paste your points. Maybe you want to collaborate to get fresh points of view about your chart? Simply click on Share and you can invite any colleague or friend to work on your documents. Just like you would with a Google doc.
You can use our charts stand-alone, or even better, use them in documents such as slide presentations, social media graphics, proposals or e-books. Xara Cloud has a huge library including all the documents that you’re likely to need, so you can always start with a template and save your precious time. Xara Cloud includes high-quality PDF download, so you can send your charts by email or print them for use offline.