Chart and Data Visualization
Create charts, infographics, and business visualizations in Xara Cloud with the new Vizzlo integration
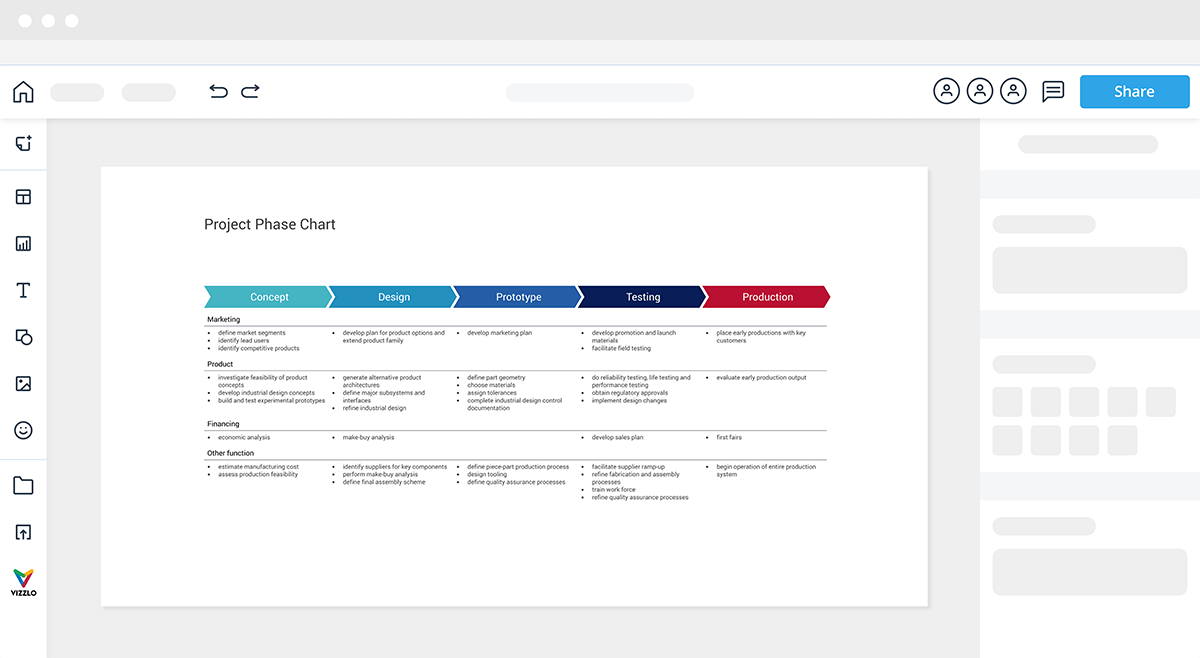
Xara has partnered with Vizzlo to bring you advanced charting and data visualization tools.
Now you can include anything from the simplest pie chart to a complex infographic in your Xara documents.
Vizzlo offers a huge inventory of customizable graphics so you can communicate every idea.
65% of your audience are visual learners
Clarity

Leave no room for doubt in the message you need to communicate.
Credibility

Instill trust and a sense of professionalism with your audience.
Retention

An image lasts longer in the memory than plain text.
Seamless workflow
Create, import and edit complex data visualizations directly from Xara Cloud. Our seamless integration eliminates the need to switch between platforms.
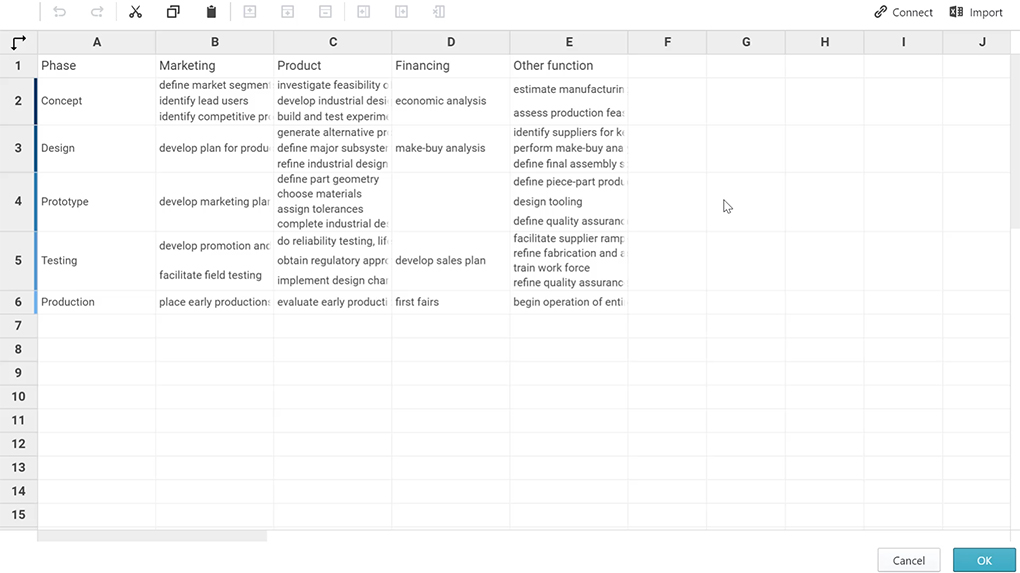
Connect to Excel and Google Sheets
Sync your charts with live Excel or Google Sheets data so that they update automatically with data changes.
Easy to create, brand and customize.
Vizzlo + Xara will make all your documents look great with automatic branding and super simple chart customization. Creating on brand and sophisticated data visualization has never been easier.
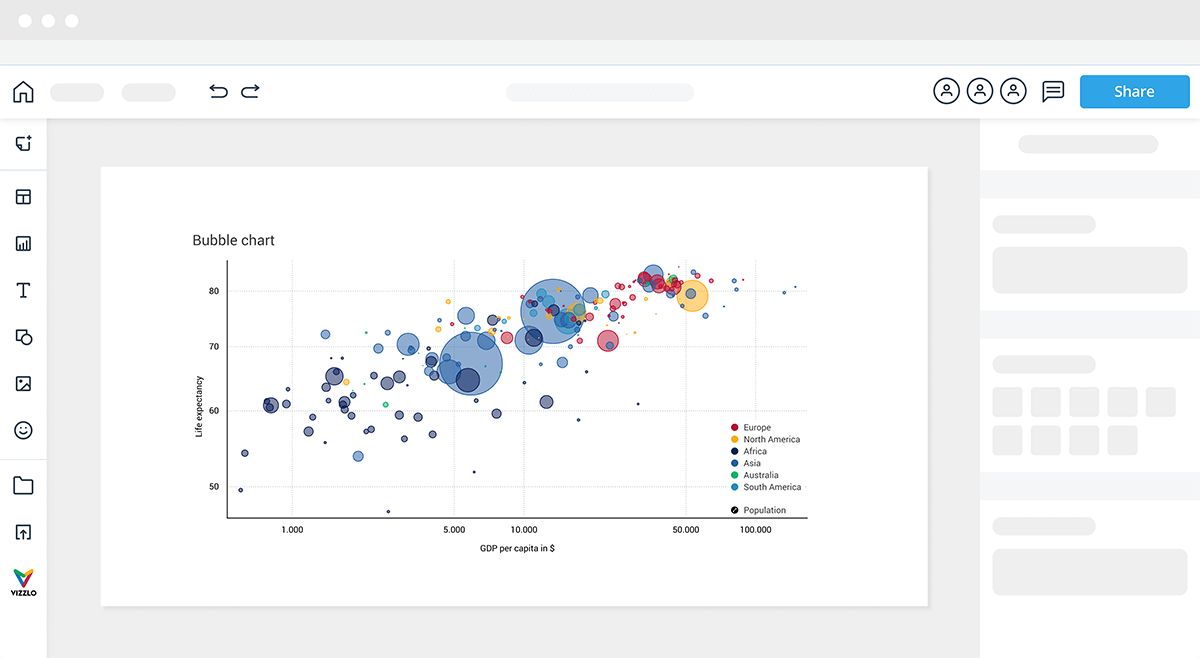
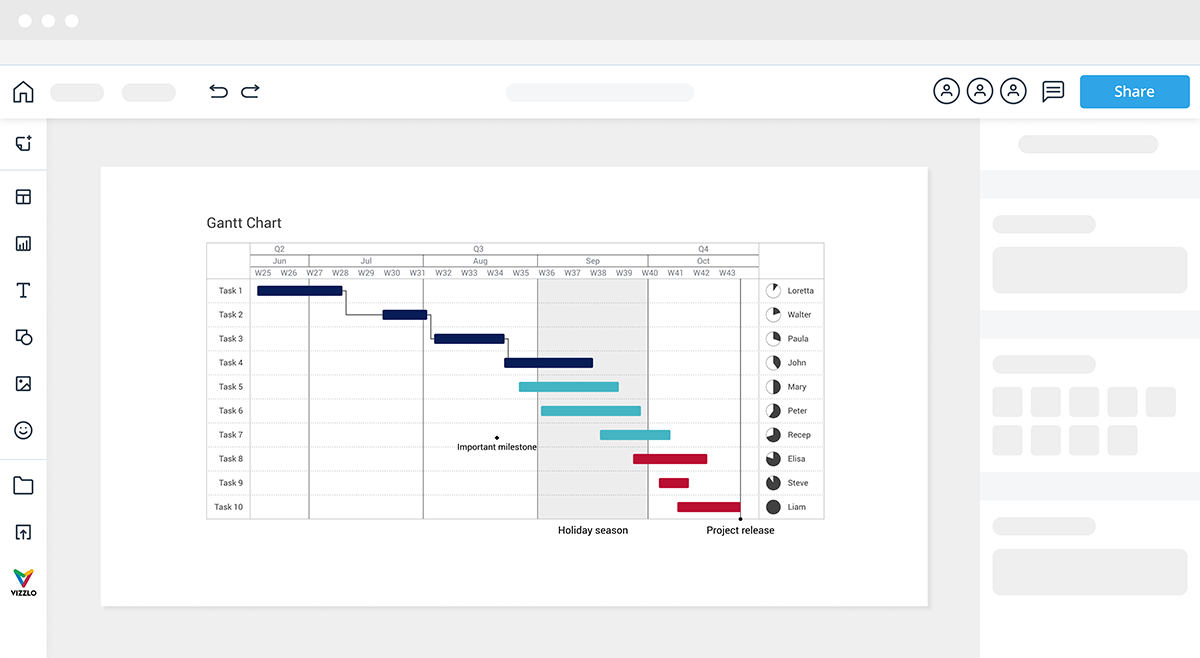
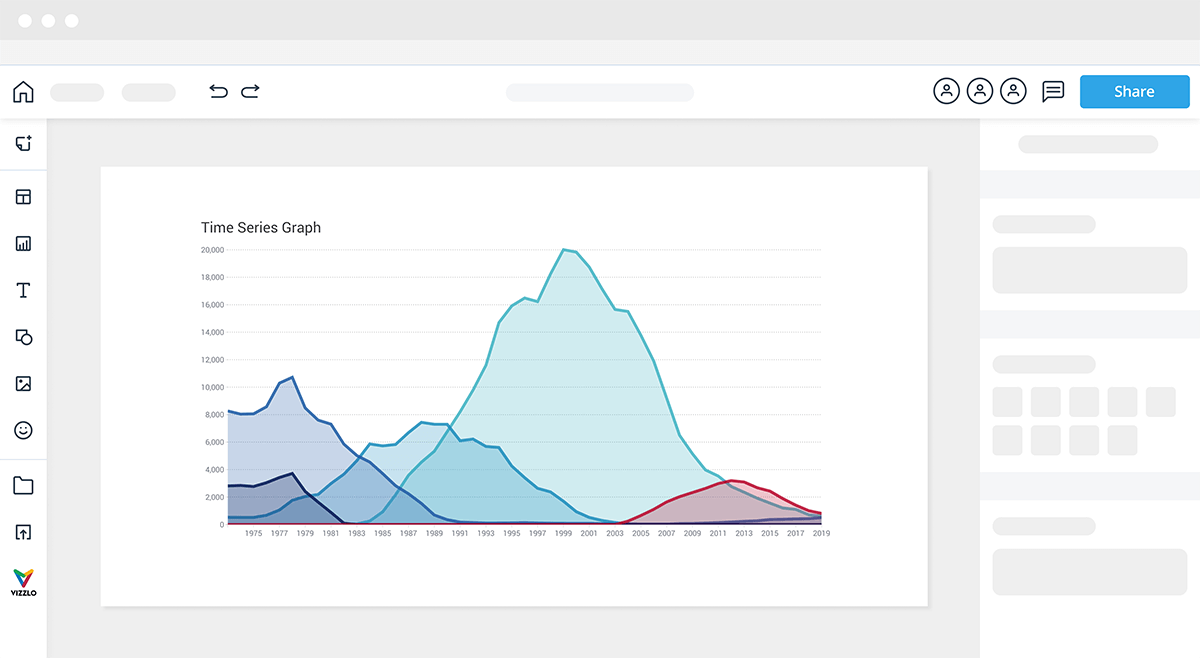
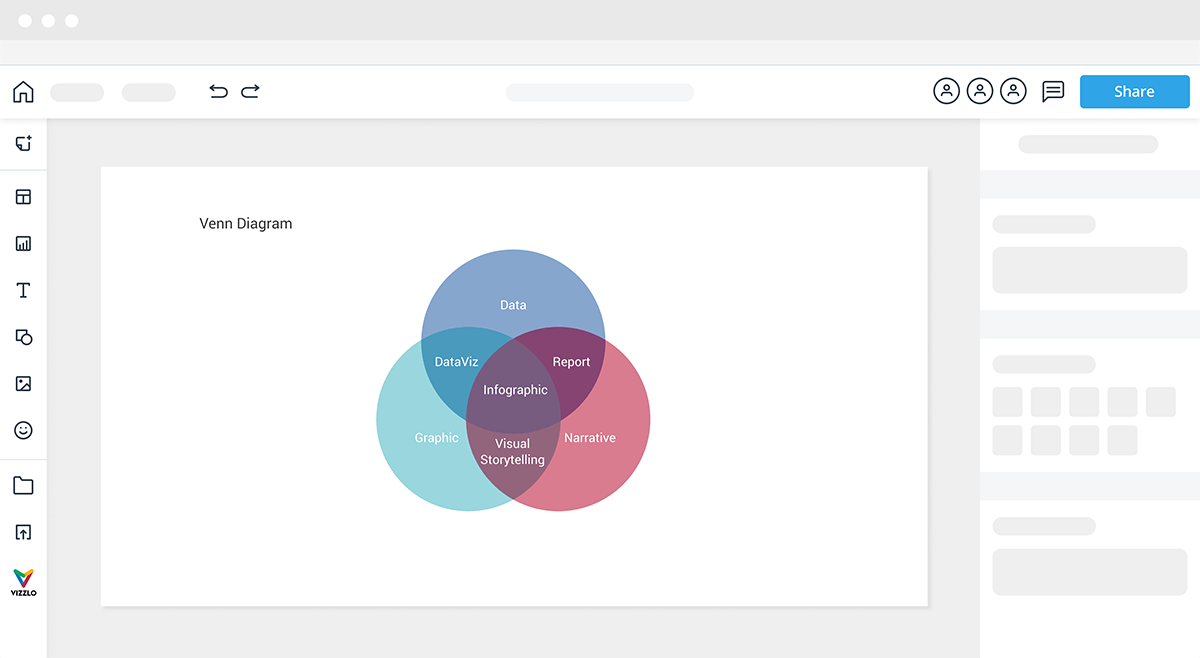
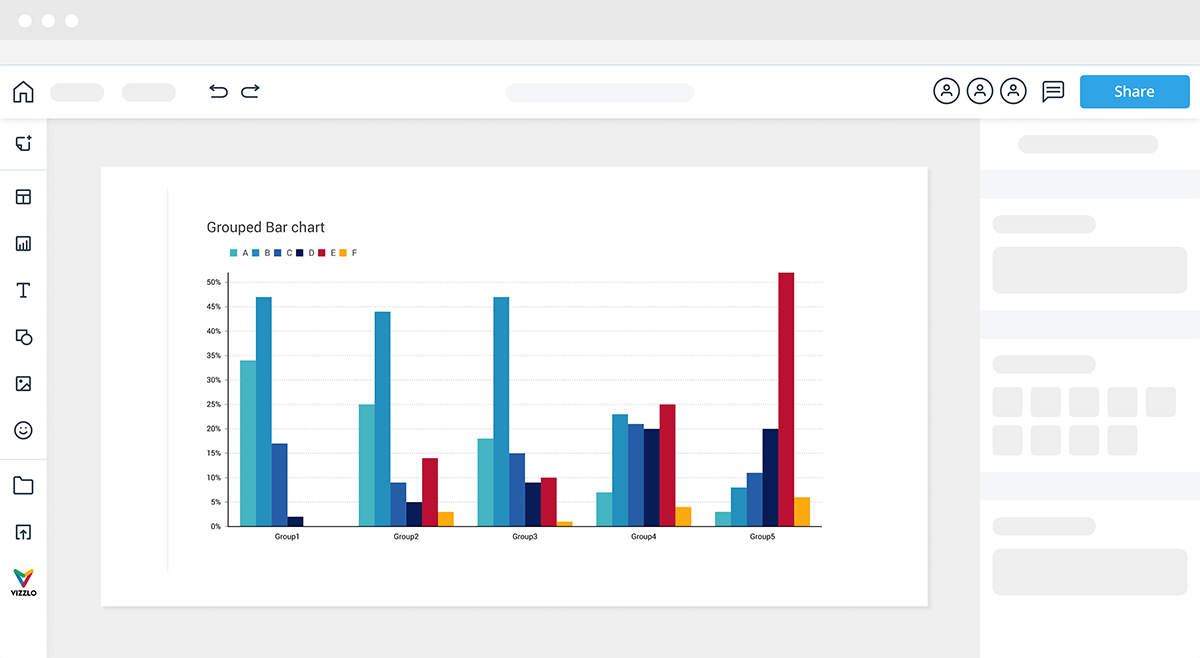
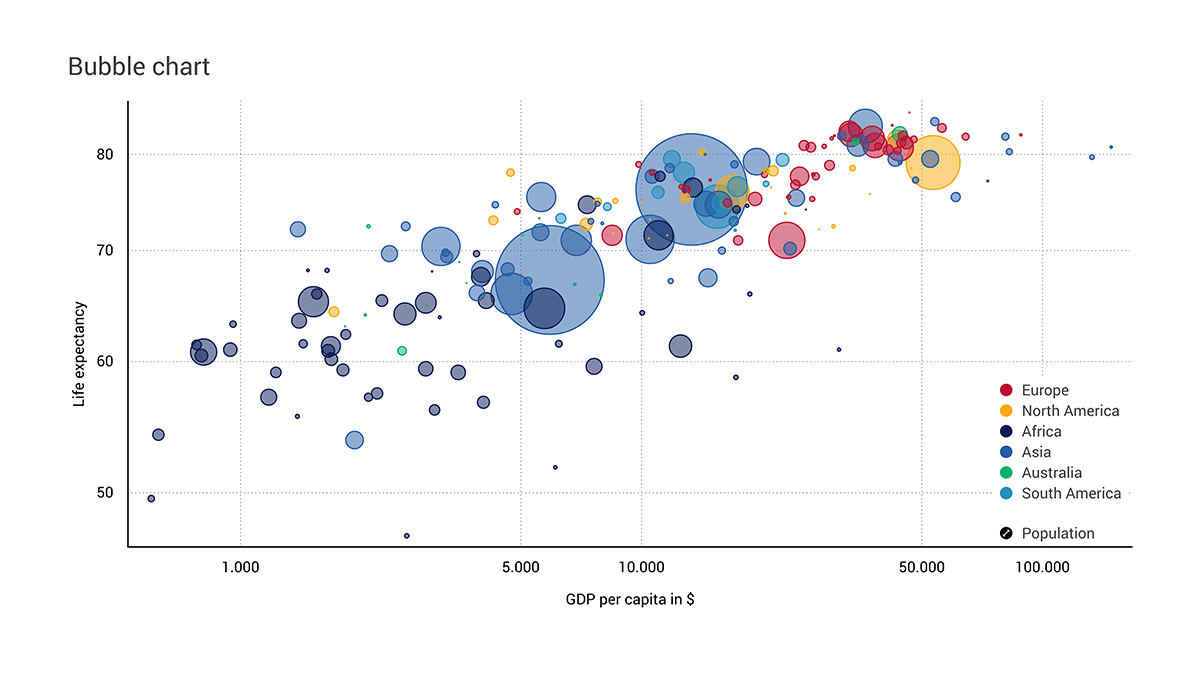
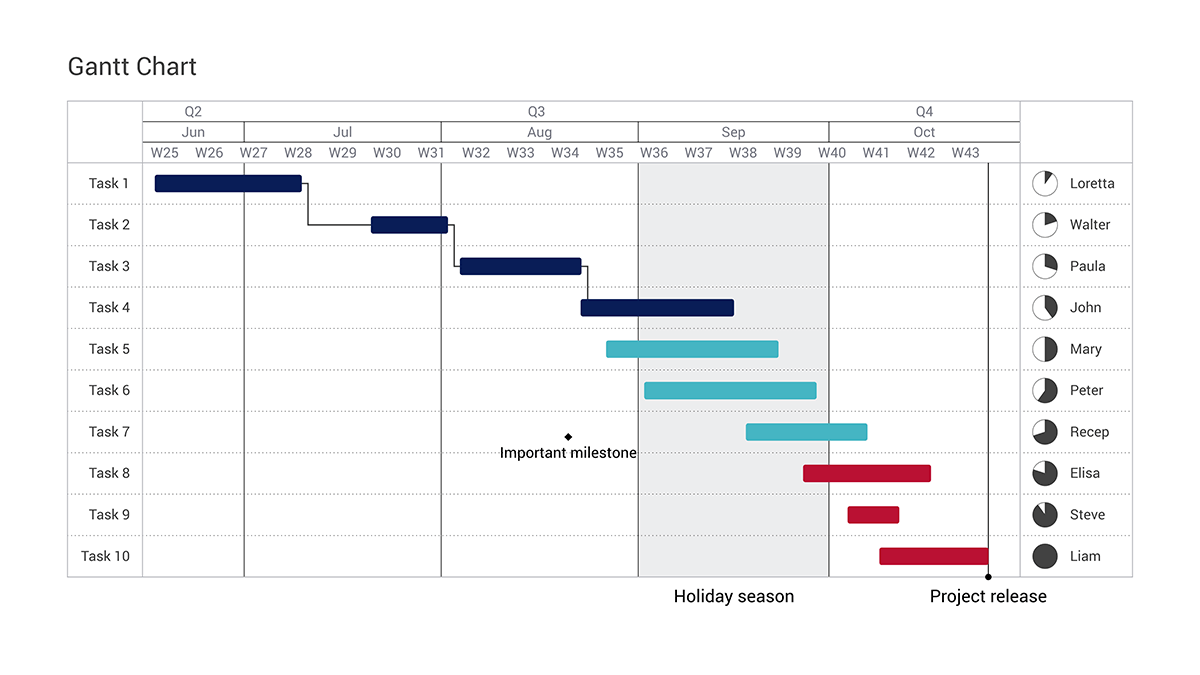
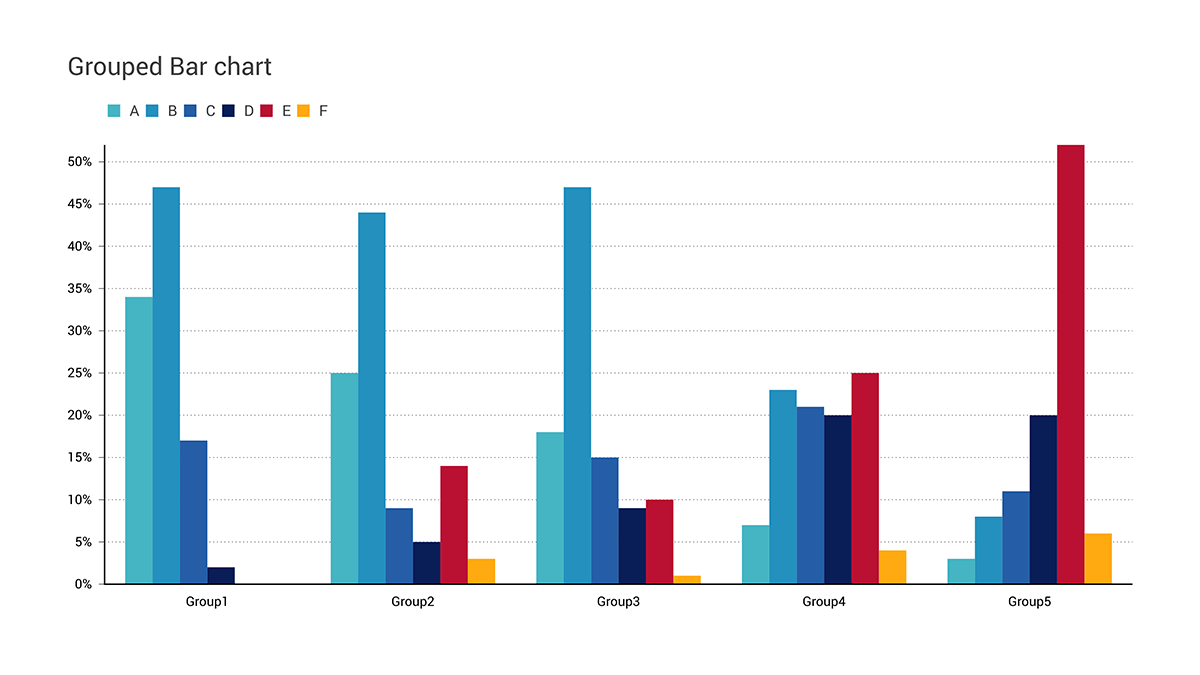
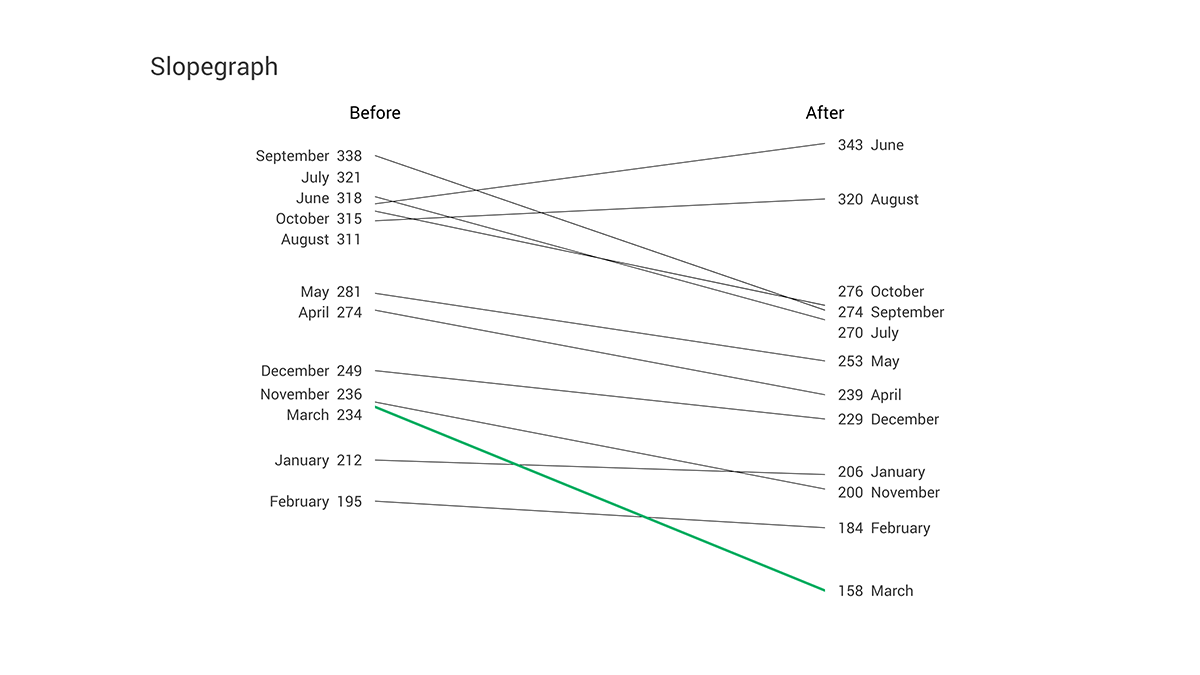
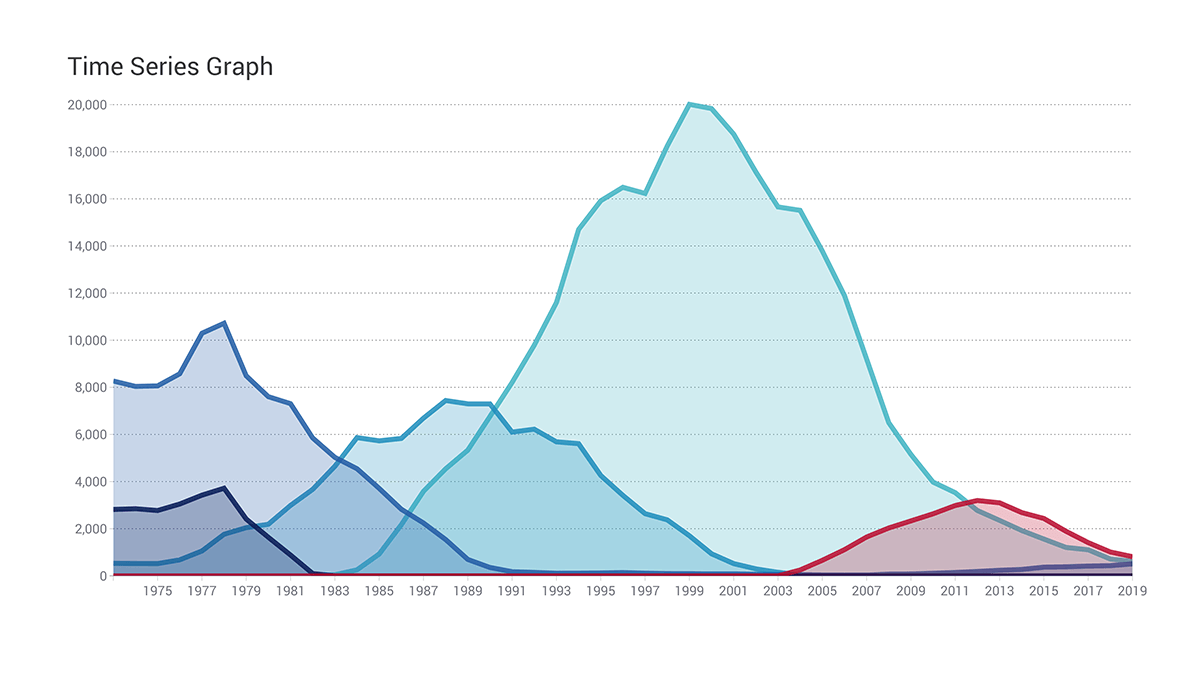
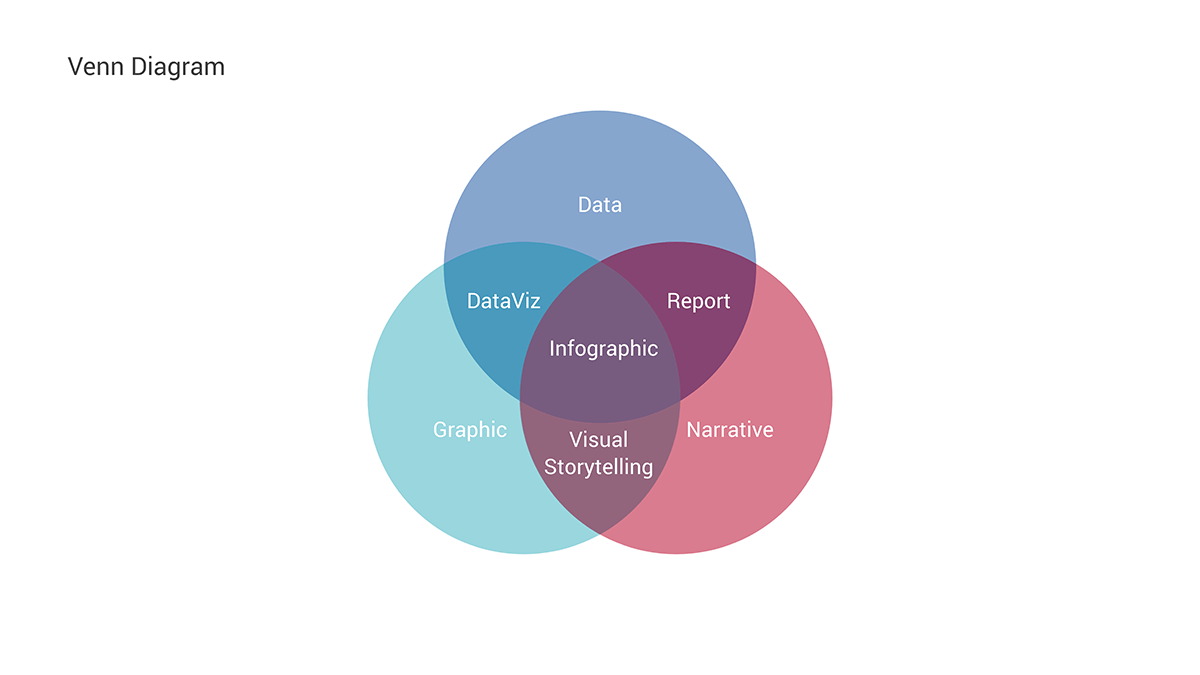
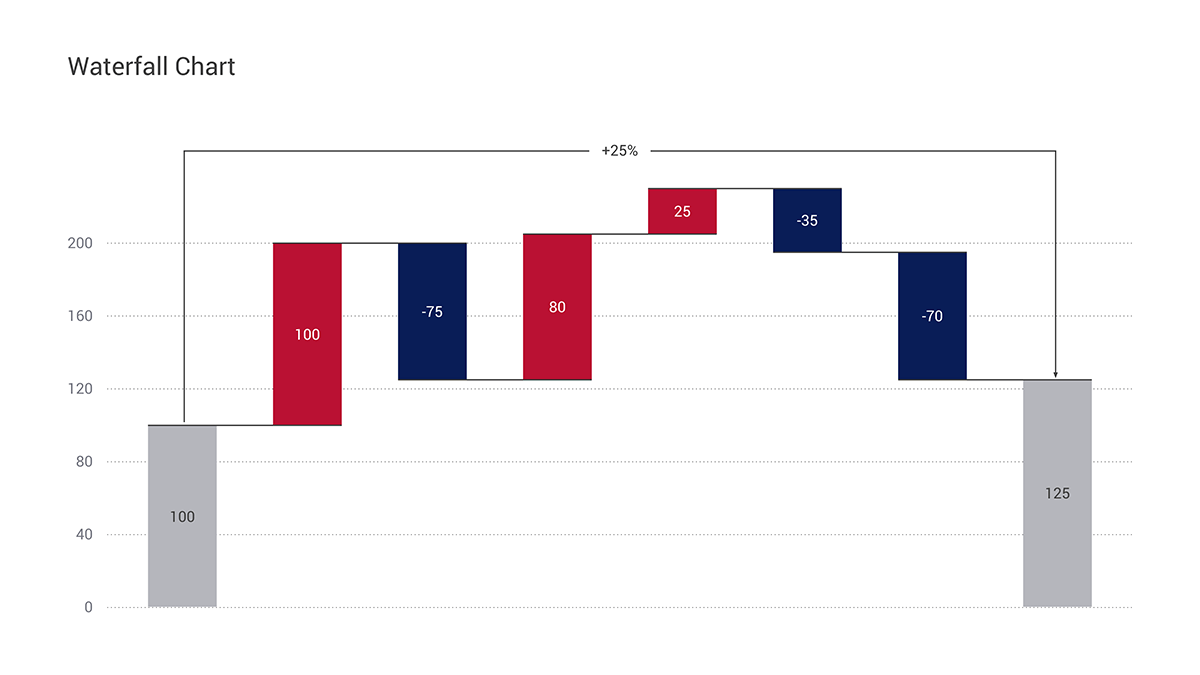
Hundreds of charts
Connect to Vizzlo’s huge library of visuals ranging from simple pie charts to sophisticated infographics.
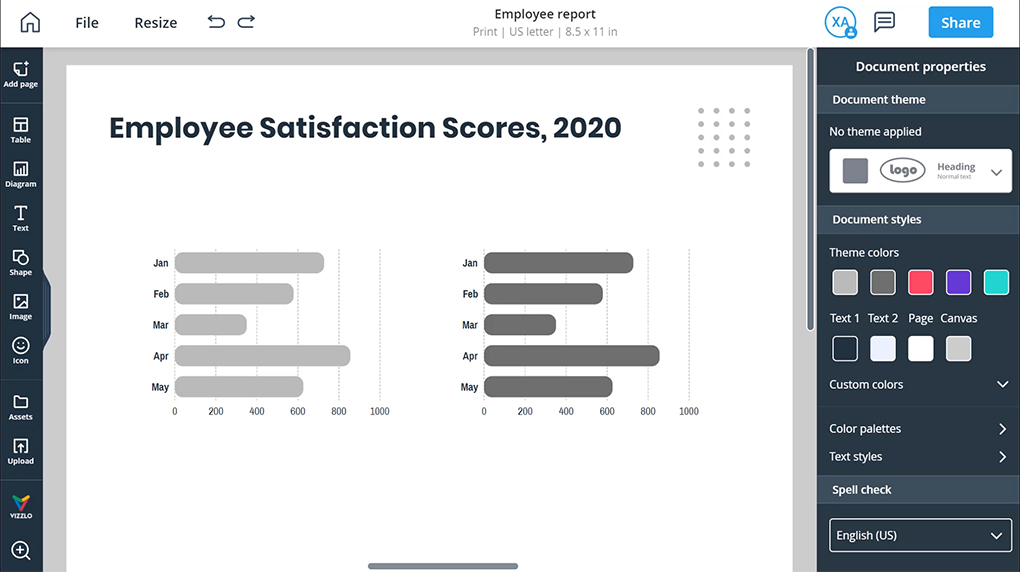
How to use the Vizzlo plugin

1. Connect Xara Cloud to a Vizzlo account.
It is free, simply click on ‘Try out’ on the diagrams tab.

2. Click on the ‘Create new’ button within the Vizzlo tab.
It will open a Vizzlo window for you to work on your chart.

3. Import and edit Vizzlo charts in Xara Cloud from your library to any Xara Cloud document.