Are infographics part of your social media strategy? If not, they should be. An infographic is 30% more likely to be read than a traditional article. Plus, it generates 12% more traffic.
SEO content comes in many shapes and forms. While you shouldn’t give up on writing text articles, you should however take into consideration other SEO-boosting options, such as infographics. That is if you want to stay ahead of the curve.
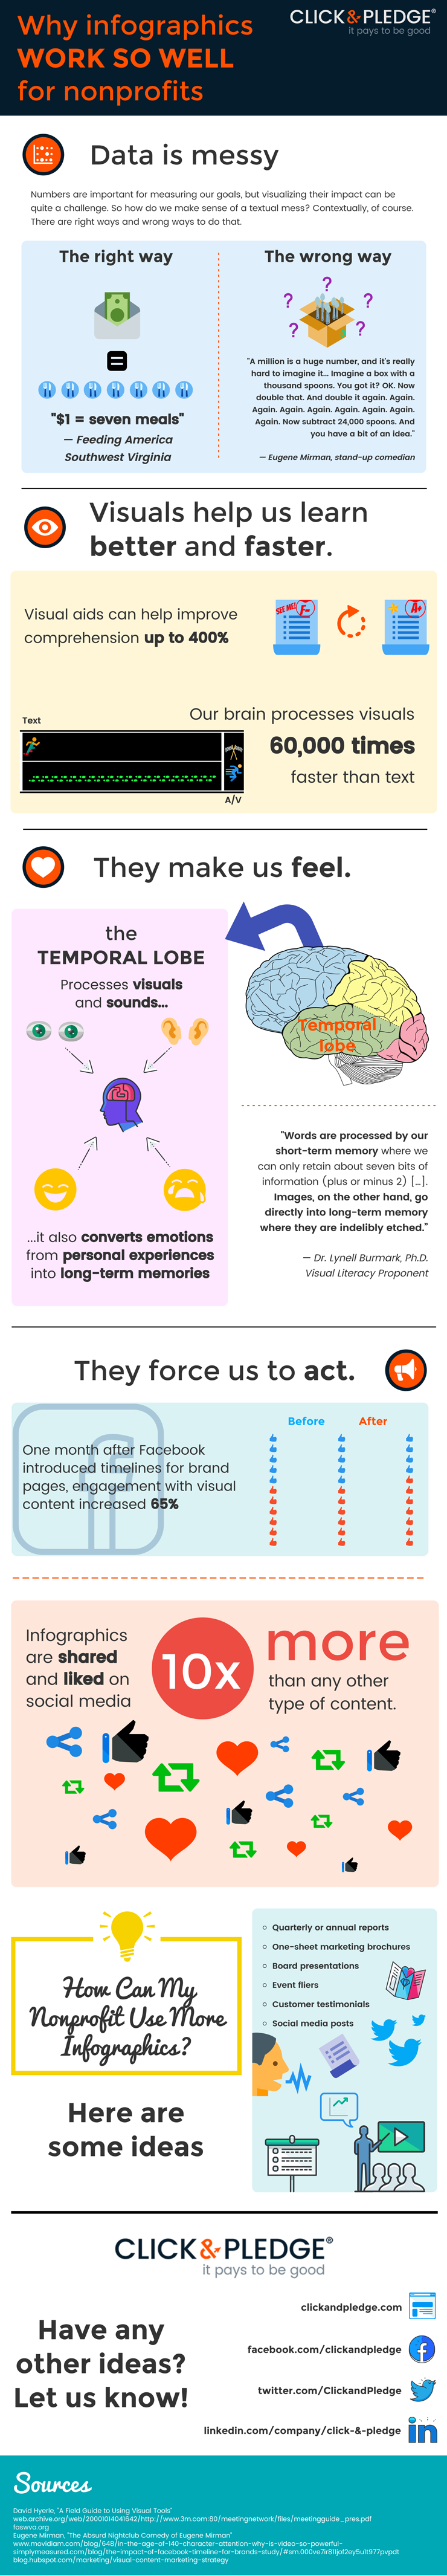
An infographic uses graphic design, data visualization, and short text to get a message across. And it’s all the rage right now.
Everyone is creating infographics nowadays. But not everyone is creating effective infographics. There’s an art to creating infographics that go viral.
Sure, you need some marketing and writing skills to make it happen. However, a truly effective infographic will follow the principles of graphic design.
We know you might not possess design skills. Luckily, you can hit the books… or the web.
To make matters easier for you, we set out on a journey to find out what makes a good infographic.
Without further ado, here are 11 infographic tips to help you generate more traffic and, hopefully, more sales in the process.
Are you ready to find out what makes a good infographic? Let’s begin!
What Is an Infographic?
Before we delve into the tips and tricks we have prepared for you, we have to understand what an infographic is.
Above all else, an infographic tells a story through visual elements and minimal text. It conveys data through visual graphs and charts. It brings concepts and dull numbers to life. Everything — from the graphic representations, images, and illustrations to the text and font combines to create a coherent story.
A story that anyone can understand.
There are seven types of infographics that you can choose from.
- Statistical
With these, you can translate complex scientific data, show survey results, or explain complicated business reports.
They aim to make the information accessible, with the use of data visualization tools, illustrations, and short text.
- List
A list infographic uses written lists to convey a message. It’s basically a written copy, but it contextualizes information with visuals. This type of infographic allows you to get your message across using data-rich text.
You can use it alongside a list blog post, as it increases readability and shareability. This is a great idea if you want to generate engagement on social media. Moreover, it can increase retention rates, as visual elements make the content more interesting and fun to look at.
- How-to
Just like how-to articles, these infographics give readers practical tips on various topics.
It works either as an excellent alternative to long pieces of content that take readers on a step-by-step process or as a complement to longer blog posts.
Overall, it adds juice to a rather dry content. This way, concepts are easier to grasp and people can process detailed instructions with ease. It’s also perfect for instructions that require visualization.
Here’s a great example we found:
- Timeline
These are pretty self-explanatory.
You can use them as part of your marketing strategy if you want to depict historical events, explain the evolution of a product, or show how a practice has developed over time.
National Geographic has some amazing, visually appealing timeline infographics. Here’s one.
- Comparison
You cannot miss out on these.
These infographics allow marketing professionals to compare different products, businesses, or concepts in a visually appealing way.
With these, readers can see the alternatives presented side to side. This visual aid helps them understand the difference between concepts, or decide which product or service is best for them.
Comparison infographics are great when you want to show how your product or brand stands out from those of competitors. It’s a great companion to a longer blog post, as it can be shared and spotted easily.
- Map or location
Map infographics can be used to communicate location-specific information or to reveal demographics. For instance, you can use them to visually communicate valuable insights about your customer base or target audience.
Researchers and science communicators use them often to share statistics about countries.
Overall, they allow readers to examine the numbers in relation to different locations or demographic features.
Once again, National Geographic has won the knock-us-off-our-feet award. Their visual content is certainly not for everyone, due to its complexity and in-depth information. These are excellent materials if you want to get educated on a scientific topic and have some fun while at it.
- Flowchart
Flowchart infographics are so versatile. You can use them to engage your audience while walking them through a process, or internally when you onboard new employees.
They make it easy to understand how to use company tools, or how to solve common issues that appear in the department.
Making infographics is fun. As you can see, you can mix and match this type of visual content however you wish. The sky’s the limit, truly.
But great infographics follow some rules. So, here are 11 tips to help you nail your infographic design.
Today, we’re going to walk you through it all: the good, the bad, and the ugly.
1. The Ideation Process
Before you even start thinking about things such as color palettes or illustrations, you need a brainstorming session. List the topics you would like to cover and choose one. Is it appropriate to use an infographic for the topic at hand?
Some subjects cannot be conveyed through an infographic.
Keep in mind that this type of visual content doesn’t allow for an in-depth analysis. For that, you might want to opt for a text article. If you see it useful, you can use an infographic to summarize the main points.
The topic idea will guide you towards a good infographic design.
2. Target Audience Matters. A lot.
Every great piece of content starts with a target audience. After all, they will be the ones reading and judging your infographics.
Taking the time to analyze your target audience will make matters easier. Here are a few questions you should ask yourself:
- Who is buying your product and consuming your content?
- Where are they most active?
- What does the data tell you about the specific audience?
In addition to helping you create the best infographics, going the extra mile on this step will also help you position your brand more effectively.
The goal is to create content that is relatable and useful for your specific audience.
3. Research Phase
You’ve got your idea set in stone. Now what?
Well, it’s time to study the data. Of course, infographics need to be eye-popping. But they are a graphic representation of data, after all.
And you need reliable, up-to-date information. This will show readers they can trust you and your brand.
It will also guide your efforts of producing quality content. So, what type of information do you want to share? What type of data will help you get your point across?
Gather all the relevant data for your specific purpose. If, for instance, you want to create an infographic about the importance of sleep you want to find reliable scientific data investigating the topic first.
P.S: Don’t forget to cite all your sources.
4. The Headline Sets the Mood
Almost every piece of content starts with a killer headline. The headline is the first thing your audience will set their eyes on.
Eight out of ten people read the headline. But only two keep on reading.
So, it has to be captivating and thrilling. Here are a few tips:
- Make it snappy. Cut straight to the point.
- Make it unique.
- Create a sense of urgency. Make them feel they’ve got something to lose.
- Make it useful.
- Include numbers.
- Make it emotional and thought-provoking.
Here are some great examples:
5. A Good Story
An infographic is not just a collection of facts and figures. That would be boring. Instead, each graphic representation, fact, and copy should add to the main story.
The idea is for the infographic to flow, just like a good story would. Connect the dots. Move the viewers through the message. How do you do that?
Well, have a consistent color palette theme and use consistent images or illustrations. You can also add visual aids such as arrows to point viewers to the next idea.
6. Long Doesn’t Equal Better
You’ve probably seen those never-ending infographics. While they manage to cover a topic in-depth, they lose points in accessibility and readability.
Infographic design should also consider this aspect.
Longer infographics such as this and this might take forever to open and read. Especially if your target audience views them off their phones. If your infographic ends up being in a square or horizontal format, that’s ok. It might even be better than the classical infographic.
7. Data Visualization And Visual Elements
Visual elements make infographics fun to read. That’s why people love them. So, show, don’t tell.
Use data visualization elements like charts or graphs to represent numerical data, and icons or illustrations to explain principles.
Illustrations and images also make the materials compelling and funky!
| With Xara Cloud, you can add beautiful data visualization elements to your infographics. Create an account, set up your layout, and just drag and drop the charts. |
8. Short And Snappy
Remember, this isn’t a blog post. An infographic is a visual communication tool, after all. Your copy needs to shoot straight to the point. The visuals and text should work together, complementing each other.
Big blocks of text are hard to look at, and they might discourage readers. If you can convey the idea through visuals, do that.
P.S: Be mindful of the font size. Readability is key here.
9. Brand Identity
Your brand’s identity should shine through any piece of content you publish. This rings true for infographics as well. But how do you do that?
- Include brand visuals such as logos, color palettes, or fonts.
- Create a story that aligns with your brand’s identity.
- Add images and graphical representations consistent with your brand’s image.
10. Don’t Forget About the White space
Designers know all about white space. It’s a basic tenet of graphic design.
Your infographic needs to breathe. White space ensures that the visual content is easy on the eye. It creates harmony and pleases our brain.
Moreover, white space allows readers to process each piece of information thoroughly.
To see just how much white space influences user experience, here are some overcrowded infographics.
Frankly, these infographics are cluttered, unreadable and, most of all, annoying.
11. Social Media Promotion
It’s time to spread the word.
You could have the best infographic. It won’t go viral unless you promote it. If you plan to create infographics that have traction and generate leads or sales, your best bet is to include them in your social media strategy.
So, make use of your social media channels. Where is your audience most active? Craft your social media post with your audience in mind and add your freshly-pressed infographic. Now watch it fly to the top!
That’s all folks. In today’s article, we highlighted what makes a good infographic. Ready to start designing?
Creating an infographic Is Now Easier With Xara
Everyone loves a great infographic. There is no reason not to include them in your marketing strategy. Creating them, however, is both fun and challenging.
Especially if you are not a designer. Well, what if we told you that there is a way? You can now create the best infographics, on a budget. Without hiring a team of designers. How?
With Xara Cloud. Our intuitive visual communication platform allows you to create everything you need to make your brand stand out– infographics, social media posts, and even e-books.
Are you ready to create eye-catching infographics for your audience? Try out Xara Cloud for free!
Sign up today for a free trial


 No credit card or phone number required.