Data is beautiful — especially when data visualization comes into play. But with tight budgets and limited resources, many small and mid-size companies aren’t sure where to start. Before going further, an organization has to understand the importance of the data collected every day, as it directly influences the success of a business.
Why dealing with data is important
Every minute, organizations are generating and collecting data. Everyone — from executives to analysts, call center workers and production line employees—can use data to make better decisions and take smarter actions. 51% of companies worldwide perceive data as an essential part to their organization’s strategy. Thus, in the long run, data is crucial for building a competitive advantage.

How your business can benefit from the effective use of data
As a business scales, so does its data and the need to drive efficiency and productivity. Data analytics will help business owners quickly identify potential workflow optimizations and even predict future market trends. By leveraging data effectively, a company is able to:
#1 Drive innovations and product improvements
Collecting and analyzing data enables businesses to understand the current market landscape and surface opportunities for new product developments that match market demands. Identifying emerging trends in the data helps identify those opportunities early.
#2 Save costs
A more targeted campaign, based on knowledge of which segment of the customer base will respond best to the campaign, means that businesses can save money. Further, a company can easily spot any inefficiencies within the organization by looking at the numbers. Reducing or even eliminating those inefficiencies will lead to further cost reductions.
#3 Boost acquisition and retention
Gain valuable insights into how your customers feel about your products or services. This can enable you to break into new markets, gain access to a larger target audience and provide your business with new leads. But this also helps you to better understand and retain your current customer base.
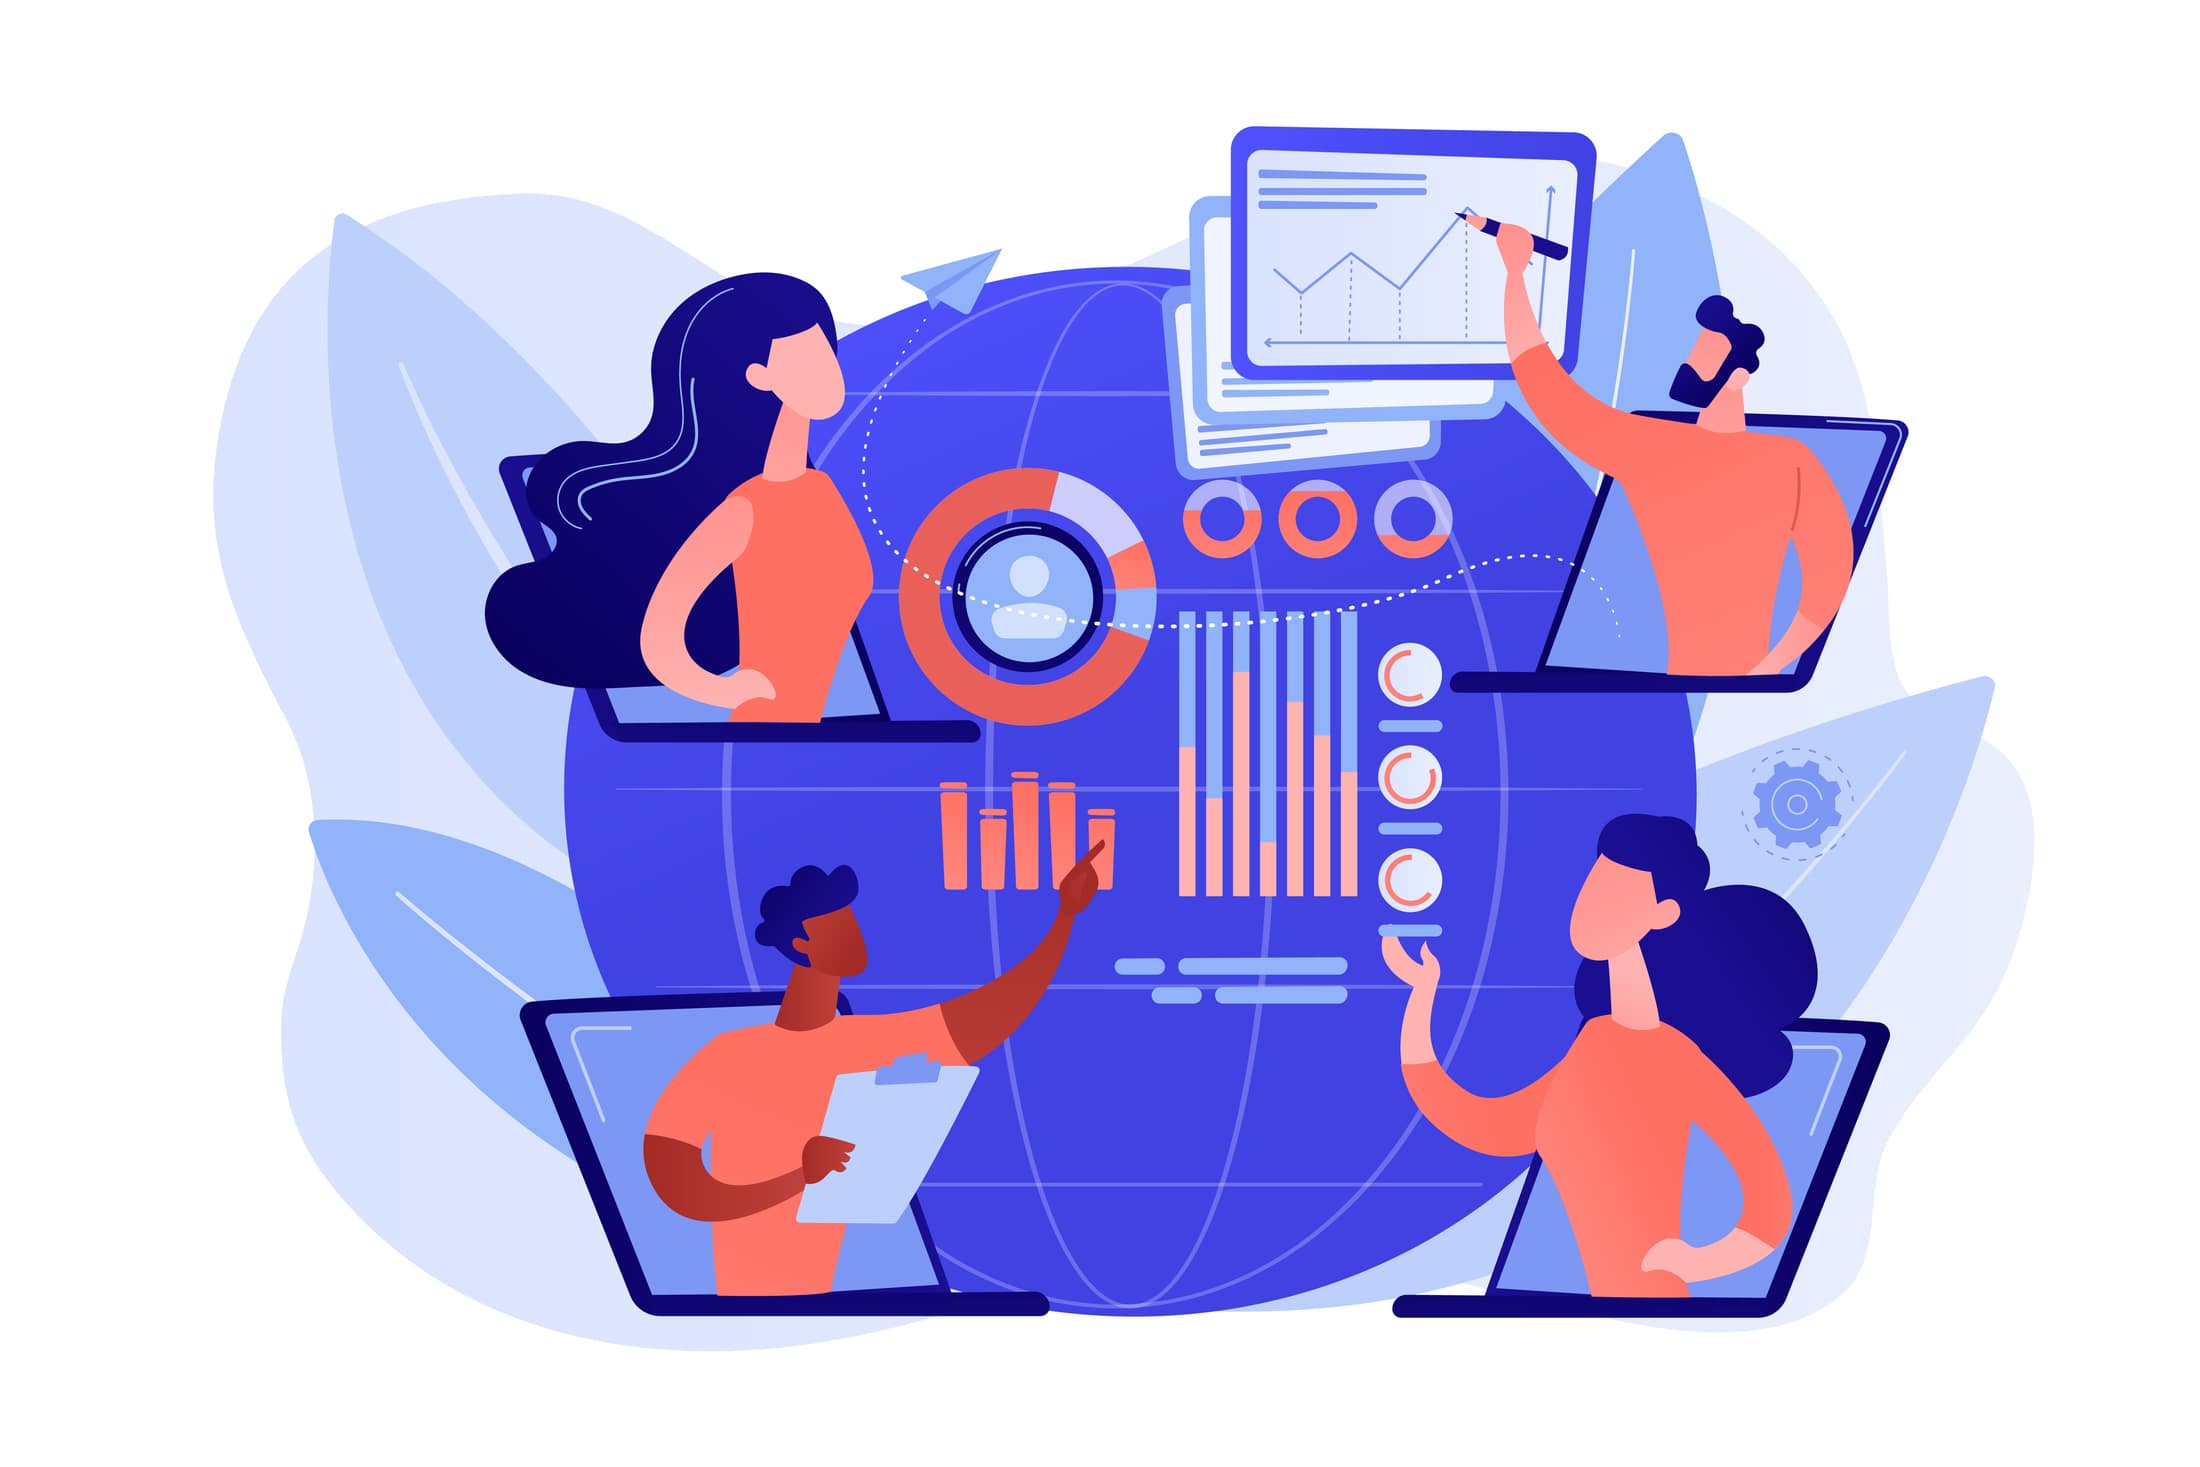
The visual representation of data
Collecting all your data and drawing insights are the first steps, then it’s time to communicate this information. So, what is data visualization? Data visualization is the graphical communication of data. It not only makes it easy for your audience to understand complex information, but also allows decision makers to see connections between complex data sets, to compare them and use them to tell a story. This makes adding charts, diagrams and other visuals perfect to use in any form of content, whether it’s outbound marketing or internal reporting.

Here are some of the key benefits of data visualization:
Audience engagement
Well-designed visuals are attractive and engaging. Adding more substance to the information you want to share helps you get your message across more effectively. The goal should always be to make your content easier to consume and share, especially on social media.
Easily repurposed
One of the main benefits of data visualization is its versatility, allowing you to repurpose it for different formats – from social media to internal reporting.
Credibility and retention
Adding data visualizations to your slides, reports, social media post, PDFs and word documents will instil trust and a sense of professionalism with your audience. Images are more likely to be remembered by your audience than plain text.
Sign up to Xara today for a free trial

 No credit card or phone number required.