
Are you constantly juggling a thousand tasks at once, only to find yourself stuck with the tedious task of creating tables? Do you want a solution that customizes your tables?
Well, you’re not alone! Manually formatting and arranging data is a drag more so when your to-do list is already miles long.
Luckily, there’s a solution to your table-making woes: online table maker tools. With these tools, you can create professional-looking tables in an instant.
We’ve scoured the web to find the 10 best online table maker tools for your business in 2026. And the best part? You don’t need any technical know-how or prior experience to use them. These tools are user-friendly, intuitive, and designed to make your life easier.
So grab a cup of coffee, and let’s dive in!
10 Best Online Table Maker Tools to Boost Conversions in 2026
1. Xara Online Table Maker
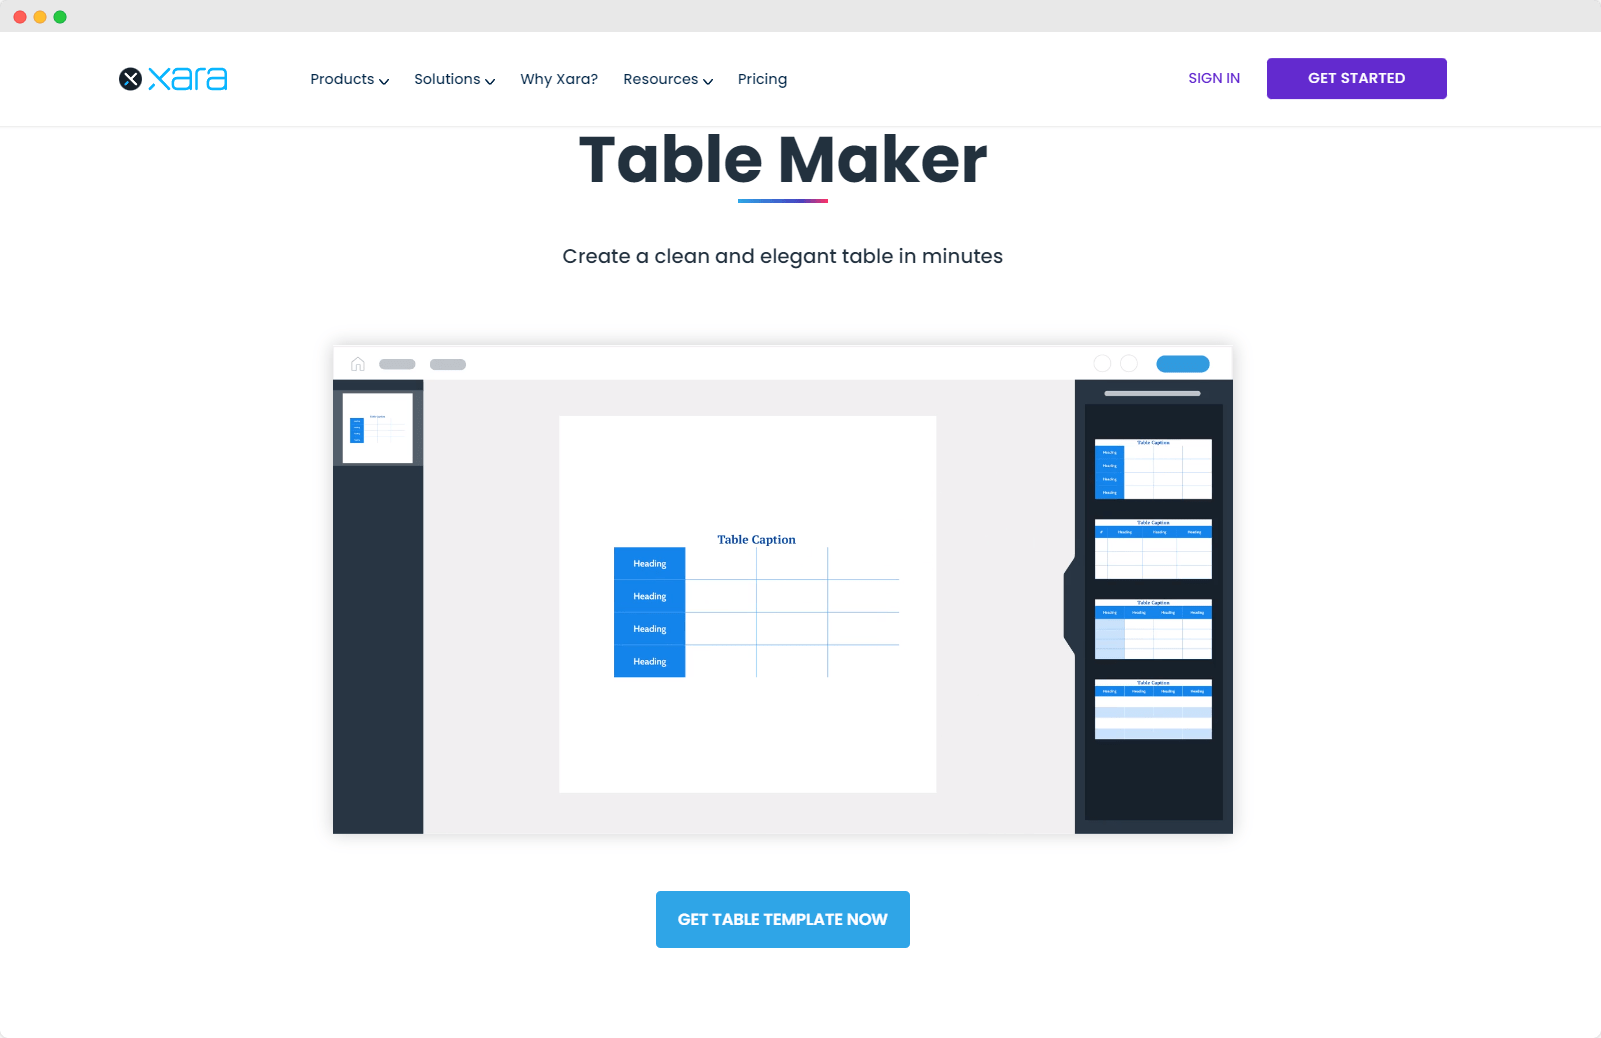 Source
First up on the list is Xara’s Online Table Maker. This online table maker tool is excellent for anyone who wants to create table charts without fuss. Its user-friendly interface and drag-and-drop editor make table creation easy. Even for those without design experience.
It’s perfect for marketers, freelancers, students, and business owners alike.
Marketers can use this tool to create tables that represent data clearly and concisely. For instance, you can use a table to showcase market trends or to highlight the results of a marketing campaign.
Additionally, you can use it to create visually stunning table charts that speak directly to customers. Want to show off your pricing plans in a social media post? Just choose a table template and customize it!
All in all, the table creator can be used for engaging social media content or professional presentations.
The best part? Xara offers a wide variety of free table templates that you can customize as you see fit. The automated branding feature keeps your brand identity in check. On all marketing materials you produce. This means you can create visually stunning table charts in no time.
Plus, it integrates with Google Sheets, making data entry a breeze. It also integrates with Vizzlo. Vizzlo is a data visualization tool that offers a wide variety of chart templates to choose from.
However, if you’re a data analyst seeking calculus or statistical analysis features, this tool may not be the best fit for you. While you can certainly use Xara’s table chart maker to present a summary of your research, it’s not designed for handling large amounts of data.
2. Google Sheets
Next up on the list of popular online table chart maker tools is Google Sheets.
This powerful and versatile tool is a favorite among many for its ability to organize and analyze data visually. Plus, it’s free and accessible to anyone with a Google account, making it a perfect choice for those on a budget.
Google Sheets is suitable for almost anyone, from students to business professionals. It’s an excellent tool for those who need to organize and analyze data.
For instance, researchers can use Google Sheets to store and analyze data. It’s an excellent tool for tracking and organizing research data, as well as creating charts and graphs to represent the data. Freelancers can also use it to create invoices, track expenses, and keep track of their work hours.
Google Sheets can handle a large amount of data, making it ideal for complex projects. The formulas and conditional formatting allow users to analyze data. It can perform simple operations, like sums, but even more complex procedures, like correlational analyses.
More so, its real-time collaboration feature enables team members to work together. Regardless of their location. This makes it an excellent tool for remote teams and distributed workforces.
However, Google Sheets also has some limitations. It can have a steep learning curve, particularly if users want to go beyond creating simple table charts. It’s quite cumbersome to use it at full capacity without prior learning.
Finally, this is not the most suitable option for creating marketing materials or other visual assets.
3. Microsoft Excel Online
And that leads us to the following tool, Microsoft Excel Online. Still a significant player in the document editing industry.
Despite its basic data visualization capabilities, Microsoft Excel Online is a powerful tool. It allows users to create, edit, and share spreadsheets, table charts, and other types of charts.
The platform offers a wide range of templates and pre-built formulas to make this process as easy as possible.
Excel Online also allows multiple users to work on a document, making it an excellent tool for collaboration. Its intuitive interface makes it a great option for inexperienced users. And let’s face it, who’s not familiar with Excel’s interface?
Plus, the online version makes it easy to work on projects from anywhere.
However, Excel Online has limitations, such as limited design options and a steep learning curve if you want to go beyond a basic table chart. Moreover, this is not the most suitable tool for those who wish to incorporate table charts into their visual marketing materials.
Despite these limitations, Excel Online is a powerful and versatile tool that can be used by almost anyone, from students to business professionals.
4. Tableau
Tableau is a powerful data visualization tool. You can use it to create tables, charts, graphs, and other visual data representations. While it’s not primarily designed as a table maker, it does offer robust table functionality.
It’s a great tool for business professionals, analysts, and data scientists who need to create and analyze complex datasets. It also comes in handy for educators who want their students to grasp complex data with ease.
One of the pros of Tableau is its ability to handle very large datasets. If you’re a big-data analyst, this tool is for you. It also allows users to create interactive visualizations allowing viewers to explore data in real-time.
On the other hand, if you want to use Tableau as a table maker, you’ll be spending $70 a month. While it’s great for those analyzing complex research data, it’s not the best option for small businesses. It’s also not the best for those who want to incorporate table charts or graphs into their visual marketing materials. Another limitation of Tableau is its steep learning curve for those not experienced in data analysis.
5. DesignCap
DesignCap is a graphic design software that’s perfect for creating marketing materials such as infographics or social media posts. But it also has a free online table maker feature that allows you to create table charts in seconds.
All you have to do is scroll through their table templates, customize them, and input your data. DesignCap offers a small selection of free table templates. For more options, you have to upgrade to a paid plan.
If you’re someone who’s looking to create professional-looking tables without fuss, then this may be the right choice for you.
One of the pros of using DesignCap’s table maker is its easy customization. The software provides ready-made templates to choose from, and you can create table charts, diagrams, pie charts, and more.
On the other hand, this table chart maker has some limitations. It doesn’t provide a brand portal, so adding brand assets to your materials is cumbersome. More so, it doesn’t provide collaboration features.
6. Google Charts
Google Charts is a powerful and free tool that allows users to create interactive charts to display on their websites. With it, users turn their spreadsheet tables into charts that can be sorted and paged.
This online data visualization tool is suitable for most, including business owners, marketers, and freelancers.
Specifically, Google Charts is particularly useful for users who need to add charts and data to websites with little effort but success.
One of the main advantages of this tool is that it’s free to use. Additionally, you can create interactive table charts. These help your audience navigate complex data.
However, it’s important to note that you’ll need to know a thing or two about HTML, JavaScript, and CSS to customize and enhance your charts. If you don’t have experience in these areas, you may need to invest time and effort into learning before making the most of this tool.
7. Lucidchart
Lucidchart is an online visual workplace for teams of all sizes. Their goal is to help teams communicate complex ideas with ease. Hence, using visual aids, such as mind maps and charts.
You can also use Lucidchart to create table charts. However, this tool is more suitable for internal company processes. Say you want to present sales data at a meeting. Everyone can contribute and provide feedback.
One of the pros of Lucidchart is that it is intuitive and easy to use, making communication more streamlined. Additionally, it is highly customizable, allowing users to tailor their charts to their specific needs.
On the other hand, Lucidchart does have a bit of a learning curve, which could be challenging for some users.
8. Creately
Creately is a popular online diagramming and visual collaboration tool that also comes with a table chart maker.
Anyone who needs to create tables to organize and present data can enjoy its functionality.
Perhaps the best thing about Creately is that it’s highly customizable. This gives users the freedom to create tables and diagrams that suit their needs. It also integrates with other apps, such as Google Drive and Jira, allowing users to import and export their data seamlessly.
However, Creately may be a bit hard to grasp for beginners, which is a limitation to consider.
9. Visme
Up next on our best online table maker tools list is Visme. Visme is an online tool for creating, editing, and sharing visual materials. While you can use it to create social media posts or videos, Visme is also a data visualization tool.
Those who wish to incorporate tables into their visual presentations or posts can use their chart maker. However, if you’re handling complex data, you might want a different tool, such as Google Sheets or Excel.
So if you’re looking for a way to showcase your data engagingly, it may suit you. The brand portal allows you to include brand elements in your materials. The Visme app integrates with many popular apps, such as Google Analytics and Google Drive.
That being said, if you want access to the brand kit feature, you have to opt for the Pro plan, which is more expensive compared to other tools out there.
10. Infogram
Infogram is primarily a data visualization tool that enables users to create infographics, charts, and maps. However, Infogram comes with a free online table creator.
Infogram table creator is great for marketers, educators, students, and business owners. For instance, marketers can use it to communicate data-driven insights to clients or stakeholders.
Similarly, educators can use this tool to teach complex data and concepts engagingly and interactively.
Creating table charts with Infogram’s table creator is as easy as dragging and dropping. Furthermore, Infogram offers a wide range of templates to choose from. Additionally, users can import data from spreadsheets, CSV files, and other sources, and they can export tables as image files or embed them on websites.
However, Infogram is not as powerful as other dedicated data processing tools. Users may need to prepare and clean data outside of Infogram before importing it into the platform.
Take Your Raw Data From Snooze-fest to Showstopper with Xara
There you have it: the best online table maker tools of 2024! But if you’re looking to take your content game to new heights, Xara can offer you much more than just table-making.
Your marketing materials will always be consistent with Xara Cloud’s automatic branding feature.
Plus, with the ability to collaborate and share your creations with others in real-time, Xara Cloud lets you connect with your team. So you can create better together.
With Xara, you can do so much more than just create a data table and call it a day. You can scale your entire content creation process and bring your brand to the front of it all.
Create stunning and effective tables with Xara CloudFAQs
1. What Is an Online Table Maker?
An online table maker is a cloud-based tool that allows users to create a table from raw data with ease.
It works by providing a user-friendly interface that enables users to input their data and customize the table’s appearance with a few clicks.
Overall, an online table maker is a valuable tool that can simplify the creation process and help individuals save time and effort.
2. How Can I Use an Online Table Maker?
The great thing about these tools is that you can use them for just about anything that requires organizing data.
For instance, you can use them to keep track of your contacts, inventory, or expenses. You can easily add, edit, and sort data to keep everything organized and up-to-date.
More so, you can plan projects and collaborate with others. You can create a project timeline, assign tasks, and track progress. It’s a great way to stay on top of things, especially when working with a team.
And finally, you can create a visual representation of boring data. Add attractive fonts and a catchy table title, and bring your presentations or social media posts to life!
3. What Features Should I Look For in an Online Table Maker?
If you want to create a table chart that stands out, here are the features you should look for in a table creator:
- Look for an online table maker that allows you to customize the design of your tables, such as fonts, colors, and borders.
- Look for intuitive editing tools.
- Import/export capabilities: Make sure the online table maker allows you to import data from other sources, such as spreadsheets. You’ll also want something that allows you to export your material as an image or PDF file.
- Look for an online table maker that allows you to collaborate with others in real-time.


 No credit card or phone number required.